ECG criteria
- Evaluate T amplitude in leads I, II, V4–V6 — where T is normally positive and well-visible, though its magnitude varies individually
- There is no strict generally accepted millimeter threshold for flattening; thresholds vary across sources and are not an independent diagnostic criterion. Roughly speaking, a T wave can be considered flat if it is <1 mm in limb leads and <2 mm in chest leads at a standard calibration of 10 mm/mV, but recording quality, lead, sex, age, clinical presentation, and dynamics are always taken into account
- Independently account for the physiological variability of T in III, aVR, aVL, and V1 — a low or negative T here is frequently a variant of norm and not a reason to speak of flattening
- In chest leads, T amplitude is evaluated relative to neighboring leads and previous ECGs, rather than relative to the amplitude of adjacent QRS complexes; standard calibration and recording quality are taken into account — there is no single numerical threshold for V-leads
- The waveform remains positive or becomes flat (isoelectric), without overt inversion below the isoelectric line
- Concomitant ST-segment changes may be present and should be evaluated separately in the clinical context, rather than as an expected companion of flattening
- Compare with the patient's previous ECGs if available — dynamics are more important than a single finding
- Exclude technical causes: artifact, incorrect electrode placement, low calibration
What it looks like on ECG
The T wave is normally asymmetric, with a smooth ascending and steeper descending limb, and is positive in leads I, II, V3–V6. With flattening, the wave amplitude decreases noticeably, it loses its distinct dome and comes to resemble a low wave, sometimes nearly merging with the isoelectric line.
Assessment by leads:
| Lead | Normal T | Flat T |
|---|---|---|
| I, II | typically positive, amplitude is variable | noticeably lower than expected, flat (roughly <1 mm) |
| III, aVR, aVL | often low or negative physiologically | not evaluated as pathology |
| V1 | may be negative in norm | not a primary criterion |
| V4–V6 | well-defined, positive | low-amplitude, flat (roughly <2 mm) relative to norm and/or previous ECG |
No strict universal millimeter criterion exists, and the provided reference points (less than 1 mm in limb leads, less than 2 mm in chest leads at 10 mm/mV calibration) are used in educational practice only as an approximate guide rather than an independent diagnostic threshold. It is important to distinguish true flattening from biphasic or negative T waves — in flattening, the wave does not cross the isoelectric line in the negative direction, but simply has low height. Flattening is described in the report as "nonspecific T wave changes" or "diffuse T flattening," evaluating the finding in conjunction with the ST segment and clinical context.
Real ECGs: 8 examples
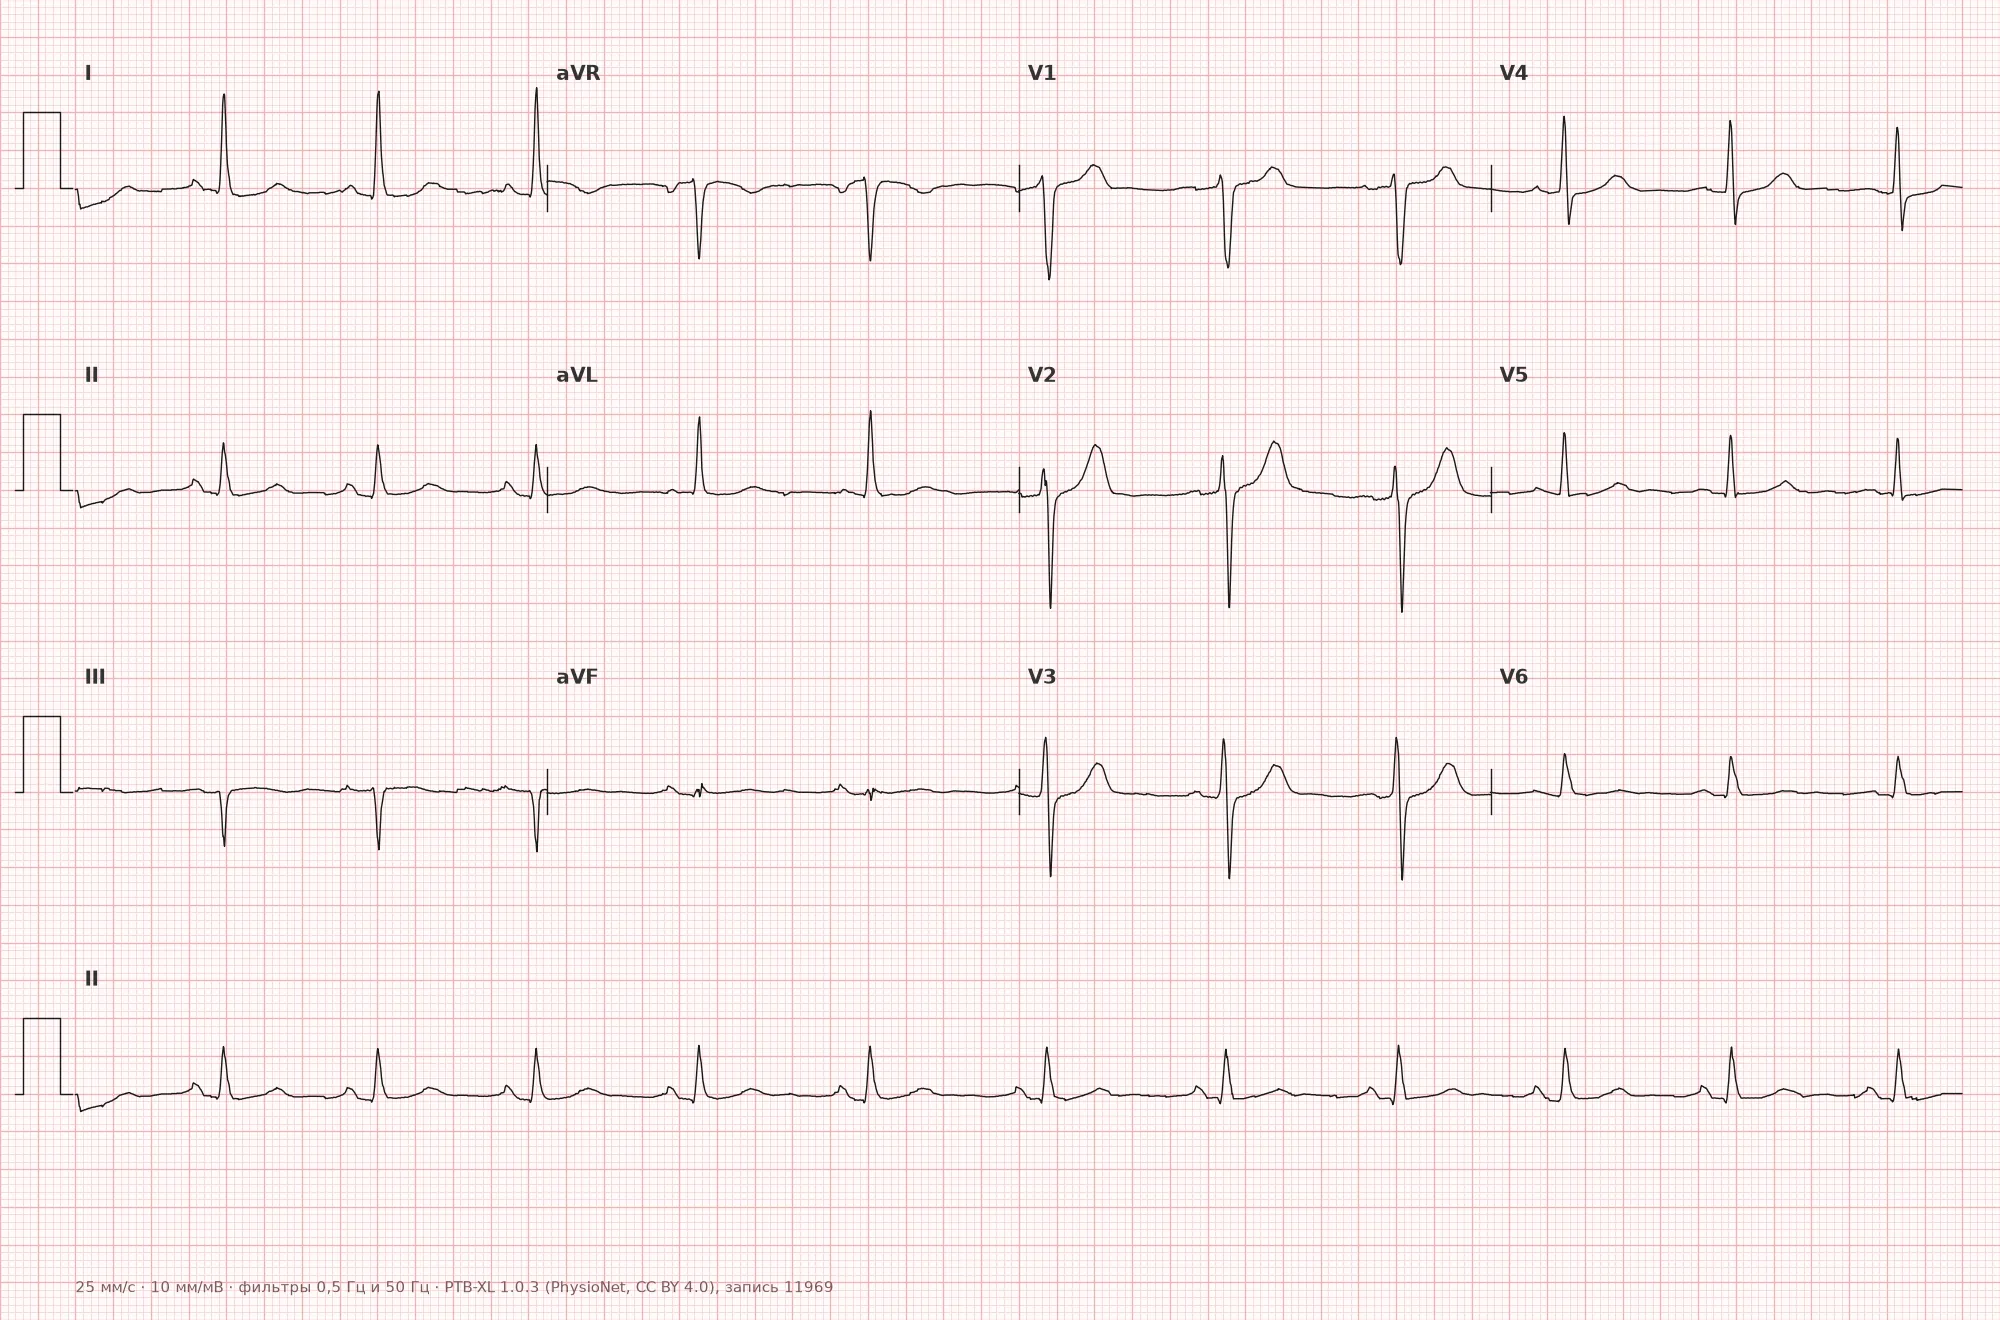
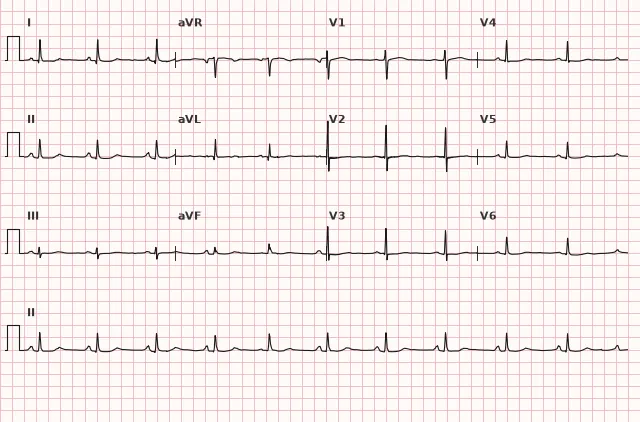
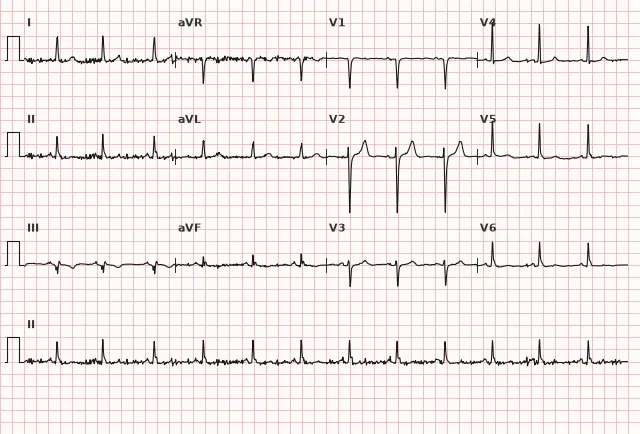
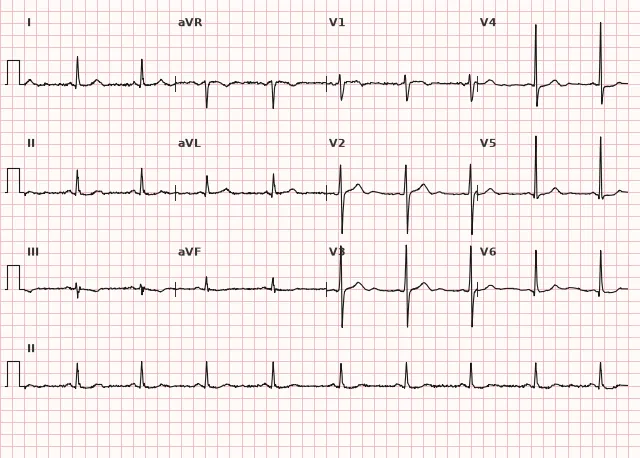
ECG from the open PTB-XL dataset (Wagner P. et al., Scientific Data, 2020; PhysioNet), CC BY 4.0 license. Rendering by WhiteCoat Pro.
Mechanism
The T wave reflects ventricular repolarization. Its amplitude depends on the repolarization gradient between the subepicardium and subendocardium, as well as the total electrical mass of the ventricles projected onto the lead. Various processes — mild ischemia, electrolyte disturbances (especially potassium), hypertrophy, diffuse myocardial injury, neurovegetative influences — can reduce T amplitude through various mechanisms without altering its polarity. Flattening is a nonspecific repolarization change; it is not a regular intermediate stage on the way to T inversion or ST depression, and the evolution of repolarization changes in a specific patient is unpredictable and depends on the cause.
Causes
- Variant of norm — low T amplitude in select leads (III, aVR, aVL, V1); in some patients, including the elderly, it is also encountered in other leads, but new or diffuse flattening cannot be automatically attributed to age without comparison with a prior ECG and clinical presentation
- Electrolyte disturbances, especially hypokalemia — T flattening/inversion, ST depression, increased U wave, and prolonged QU interval progress with the severity of potassium deficiency; the finding is nonspecific and requires laboratory confirmation
- Myocardial ischemia — nonspecific ST-T changes, including in unstable angina
- Left ventricular hypertrophy (with overload)
- Hypothyroidism
- Myocarditis, cardiomyopathies
- Use of certain medications (antiarrhythmics, psychotropics)
- Hyperventilation, anxiety, autonomic influences
- Pericarditis — T flattening itself is not a specific phase; typical dynamics in acute pericarditis include diffuse ST elevation with PR depression, followed by ST normalization and T inversion; T flattening is mentioned only in comparison with the characteristic clinical picture and these dynamics
- Obesity, pulmonary emphysema (due to altered electrical position of the heart)
Differential diagnosis
- Negative T wave — crosses the isoelectric line downward; this is a qualitatively different change, not merely low amplitude
- Biphasic T wave — has both a positive and a negative phase
- Pseudonormalization of the T wave — a previously negative T temporarily becomes positive/flat during an ischemic episode, requiring comparison with old ECGs and clinical correlation
- Low QRS voltage with a proportionally low T — here the amplitude of the entire complex is reduced, not just T
- Technical artifact (poor electrode contact, baseline wander) — excluded by repeat recording
Clinical significance and management
Isolated T flattening — a nonspecific finding that often requires no action, especially in the absence of symptoms and a normal remaining ECG. It is important for the clinician to evaluate the finding in context: clinical presentation (chest pain, shortness of breath, weakness), comparison with previous ECGs, and concomitant ST-segment changes.
In acute coronary syndrome, isolated T flattening without ST elevation is classified as nonspecific ST-T changes and does not justify reperfusion therapy according to STEMI criteria; management is determined by the clinical presentation and dynamics within non-ST-elevation ACS, including serial ECGs and repeat troponin. If ischemic symptoms are present (chest pain, shortness of breath, dynamic changes), urgent evaluation for ACS takes priority over awaiting electrolyte results. If an electrolyte etiology is suspected, potassium, magnesium, and, as indicated, calcium are checked separately. In diffuse flattening in a patient with hypothyroidism or cardiomyopathy, further investigation of the underlying condition is warranted.
Common interpretation errors
- Interpret a physiologically low T in III, aVR, aVL, V1 as pathology
- Apply an arbitrary millimeter threshold as a universal diagnostic criterion for flattening
- Fail to compare with previous ECGs, missing dynamic pseudonormalization
- Write "T flattening" in the presence of true T inversion — polarity must be accurately described
- Ignore concomitant ST depression, which alters the clinical significance of the finding
- Disregard technical causes (artifact, incorrect electrode placement) before interpreting as pathology
1. Which feature distinguishes a flat T wave from a negative T wave?
A flattened T wave remains at or above the isoelectric line, whereas a negative T wave clearly extends below it.
2. Which of the following causes most typically produces diffuse T wave flattening combined with the appearance of a U wave?
Hypokalemia classically presents with T wave flattening and the appearance/prominence of a U wave, particularly with clinically significant potassium depletion.
3. In which lead is a low T wave amplitude considered a normal variant rather than pathology?
In aVR (as well as frequently in III, aVL, and V1), a low or negative T wave is a physiological variant, not pathology.
Frequently asked questions
Is a flattened T wave on an ECG dangerous?
T wave flattening by itself is a non-specific and often benign finding. Its significance depends on the clinical context: when combined with chest pain, ST-segment depression, or dynamic changes compared to prior ECGs, it may indicate ischemia or electrolyte disturbances.
How to distinguish a flattened T wave from a negative one?
A flattened T wave does not cross below the isoelectric line; it simply has low amplitude and may be positive or nearly isoelectric. A negative T wave clearly points below the isoelectric line—this represents a qualitatively different repolarization abnormality.
Can T wave flattening be a normal variant?
Yes, in leads III, aVR, aVL, and V1, a low or flattened T wave is a common finding. In some individuals, including the elderly, a physiologically small T wave can also be seen in other leads; however, new or diffuse flattening requires comparison with a previous ECG rather than automatically attributing it to age.
What laboratory tests are needed when a flattened T wave is found on ECG?
If ischemic symptoms are present (chest pain, dyspnea, dynamic ECG changes), the primary approach is ACS evaluation—serial ECGs and high-sensitivity troponin. If an electrolyte etiology is suspected, potassium and magnesium levels should be checked, along with calcium and thyroid function tests as clinically indicated.
Does T wave flattening differ from non-specific ST-T changes?
T wave flattening is a form of non-specific ST-T changes; the term is used when there is solely a decrease in T wave amplitude without significant ST-segment changes or overt inversion.
ECG Course
Interpretation from basics to myocardial infarction — learn to read any ECG using a systematic algorithm.
- Video lessons and theory for every topic
- Simulator case studies under every lesson
- Unlimited ECG simulator practice
- Study guide: "All ECGs in 25 minutes"
ECG Strip Simulator
ECG, radiology, histology, pathomorphology, pharmacology — thousands of flashcards with detailed explanations.
- Real ECG strips, not textbook drawings
- Instant answers and explanations
- Streaks and progress tracking in your dashboard
Related terms
More in the section «Basics: waves, intervals, axes»
Sources
- Goldberger A.L. Clinical Electrocardiography
- Hampton J.R. The ECG in Practice
- Surawicz B., Knilans T. Chou's Electrocardiography in Clinical Practice
- Orlov V.N. Guide to Electrocardiography
Educational material for medical students and physicians. Does not replace clinical guidelines and physical examination; the ECG must always be interpreted in conjunction with the clinical picture.