ECG criteria
- Find the isoelectric line: the level of the TP segment preceding the P wave; if the TP segment is poorly visible, use the PR segment (if not displaced, by comparing with adjacent complexes and leads)
- Identify the J point: the junction between the QRS complex and the ST segment
- Measure the displacement of the J point below the isoelectric line in mm (1 mm = 0.1 mV)
- Assess the morphology of the ST segment: horizontal, down-sloping, or up-sloping
- For acute ischemic changes (ACS): new horizontal or down-sloping depression ≥0.5 mm at the J point in two contiguous leads
- For exercise ECG: horizontal or down-sloping depression ≥1 mm at 60–80 ms after the J point, persisting for ≥0.08 s, typically in three consecutive complexes and in corresponding leads according to the exercise test protocol
- Correlate the leads with the anatomical wall (septal, anterior, lateral, inferior)
- Exclude reciprocal depression associated with ST-elevation in opposite leads; in case of horizontal depression in V1–V3, evaluate posterior leads V7–V9
- Account for heart rate, T wave, and clinical context (exercise, medications, electrolytes)
What it looks like on ECG
The J point is displaced below the isoelectric line, which is determined by the level of the TP segment before the P wave (or the PR segment if TP is poorly visible and not displaced). ST-segment morphology is a key interpretation factor:
| Morphology | Description | Significance |
|---|---|---|
| Horizontal | The ST segment runs parallel to and below the isoelectric line throughout its course | More suspicious for ischemia, especially if new, dynamic, and accompanied by symptoms |
| Down-sloping | The ST segment slopes downward from the J point to the T wave | More suspicious for ischemia, especially if new, dynamic, and accompanied by symptoms |
| Up-sloping | The ST segment slopes upward from the J point toward the T wave with a gradual decrease in depression | Low specificity, often seen in tachycardia; does not rule out ischemia |
The measurement point varies depending on the clinical context. ACS criteria use a new horizontal or down-sloping ST depression of ≥0.5 mm in two contiguous leads, evaluated at the J point. Exercise testing classically measures horizontal or down-sloping depression of ≥1 mm at 60–80 ms after the J point, persisting for at least 0.08 s. Up-sloping depression is less specific for ischemia, but its significance depends on magnitude, workload, dynamics, and the clinical picture.
In non-ST-segment elevation ACS (NSTE-ACS), ST depression is frequently accompanied by inverted or biphasic T waves in the same leads. Diffuse ST depression—for example, in leads I, II, aVL, and V4–V6—especially when accompanied by ST elevation in lead aVR, indicates severe subendocardial ischemia. This pattern may be associated with multivessel disease, left main coronary artery disease, or proximal LAD disease, but a single ECG cannot reliably determine the specific coronary anatomy. Management depends on the clinical presentation, hemodynamics, ECG dynamics, and overall NSTE-ACS risk stratification.
Real ECGs: 8 examples
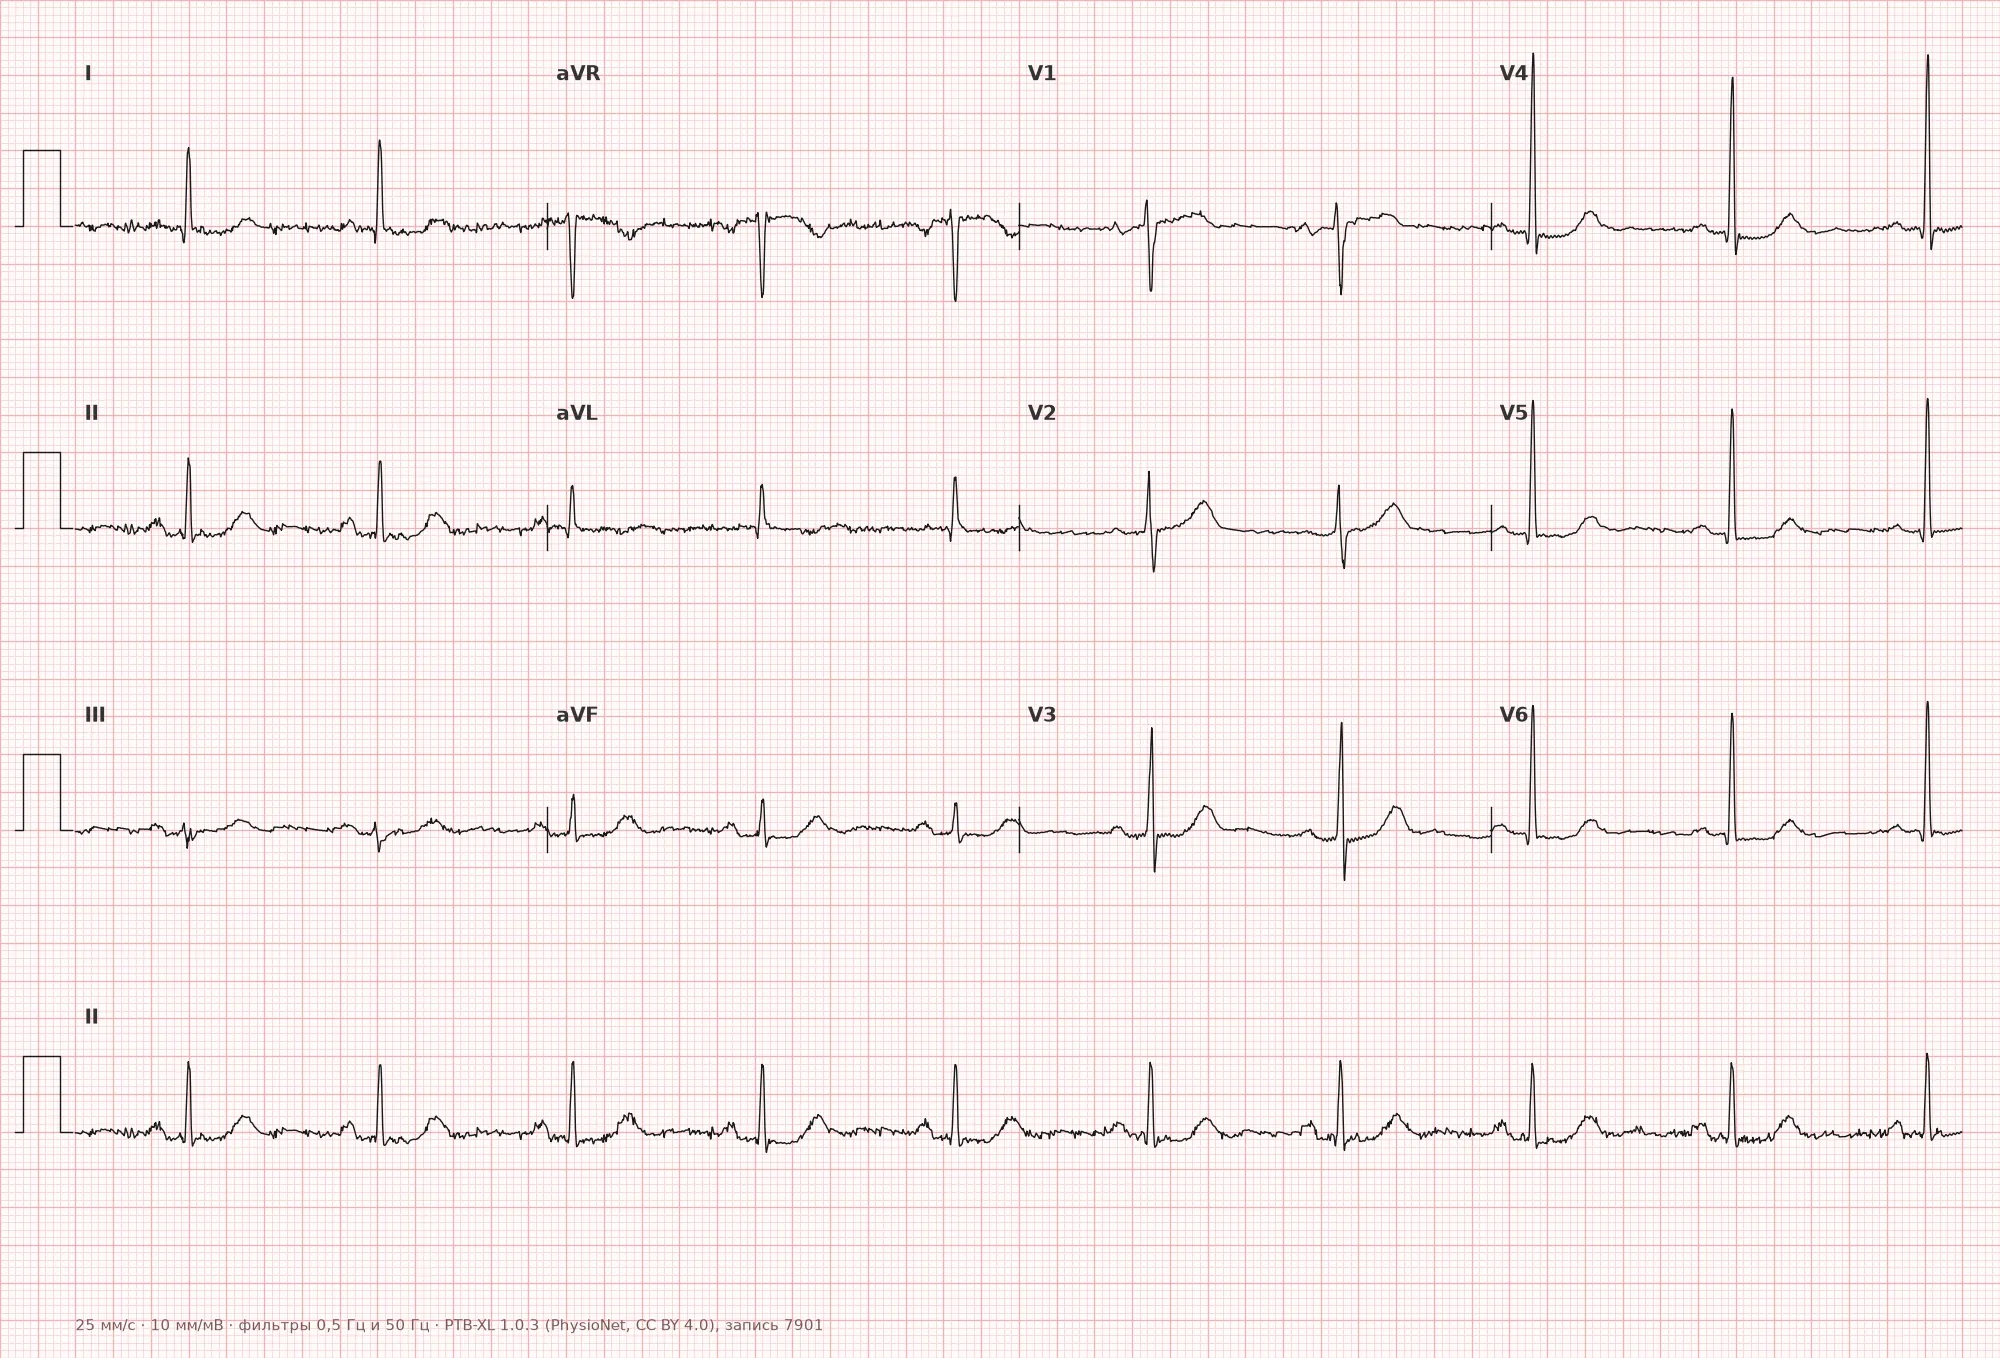
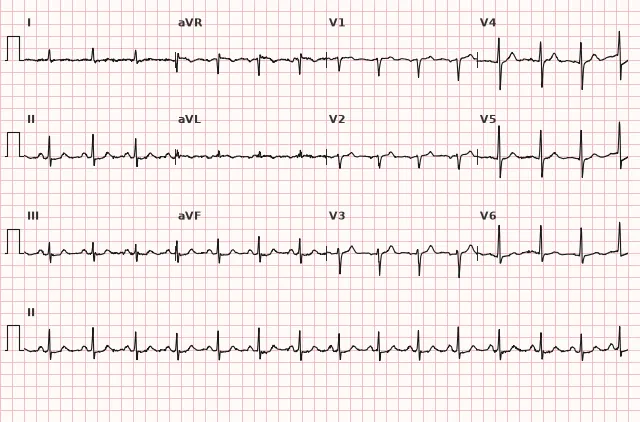
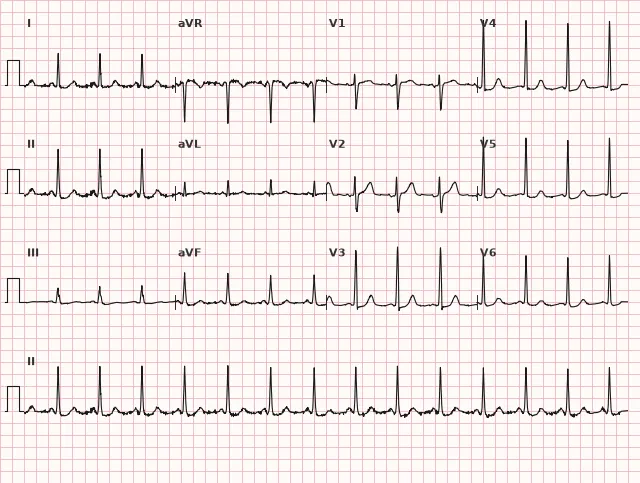
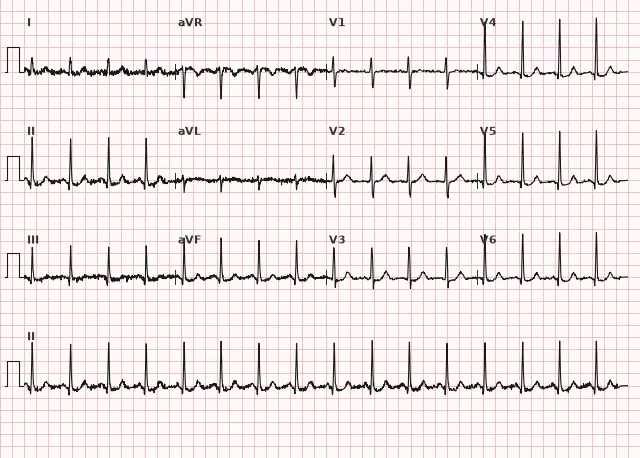
ECG from the open PTB-XL dataset (Wagner P. et al., Scientific Data, 2020; PhysioNet), CC BY 4.0 license. Rendering by WhiteCoat Pro.
Mechanism
In subendocardial ischemia, the inner myocardial layer is primarily affected; it has a poorer blood supply and is the first to experience oxygen deficiency during increased workload or decreased coronary reserve. Subendocardial ischemia alters transmembrane potentials and generates currents of injury that typically manifest as ST depression on surface leads. The direction and magnitude depend on the extent of ischemia and lead orientation. ST elevation in acute coronary occlusion is related to currents of injury in transmural myocardial injury and cannot be mechanically reduced to a simple mirror image of the subendocardial mechanism.
Causes
- Myocardial ischemia: NSTE-ACS, stable angina during exercise testing, multivessel disease
- Reciprocal changes in acute STEMI in opposite leads
- Left ventricular hypertrophy with systolic overload (down-sloping depression with asymmetrical inverted T waves in V5–V6, I, aVL)
- Digitalis effect (scooped/sagging ST depression — not a sign of ischemia)
- Hypokalemia
- Tachycardia of any etiology (usually up-sloping, but does not completely rule out ischemia)
- Bundle branch block (secondary ST-T changes)
- WPW syndrome (secondary repolarization changes)
- Myocarditis, volume overload
Differential diagnosis
- Up-sloping depression in tachycardia — the curve rapidly returns to the isoelectric line; however, tachycardia itself and the up-sloping morphology do not rule out ischemia, especially during exertion — clinical presentation, dynamics, and depression magnitude at the standard measurement point must be assessed, along with the cause of tachycardia, and the ECG repeated after rate correction
- Digitalis effect — characteristic scooped ("sagging") depression with a shortened QT interval, differing from ischemic depression in morphology and history of drug administration
- Secondary changes in LVH — ST depression combined with high QRS voltage and asymmetrical inverted T waves in the same leads showing high R waves
- Reciprocal depression in STEMI — look for ST elevation in electrically opposite leads, but ST depression can be the only visible manifestation of a posterior MI or an acute occlusion equivalent, especially horizontal depression in V1–V3: in this case, posterior leads V7–V9 are required, and management is guided by the entire clinical picture rather than the presence of ST elevation in standard leads alone
- Diffuse depression with ST elevation in aVR — a sign of severe subendocardial ischemia, potentially indicating multivessel disease, left main, or proximal LAD disease, but not an automatic equivalent of left main occlusion
Clinical significance and management
In a patient with suspected ACS, a new horizontal or down-sloping ST depression of ≥0.5 mm in two contiguous leads is a significant ischemic ECG sign and increases risk, but the diagnosis of NSTE-ACS is established based on the clinical presentation, serial ECGs, and troponin levels while ruling out alternative causes. Confirmed NSTE-ACS requires risk stratification using validated scores (e.g., GRACE) and an invasive strategy timed according to the risk category (immediate for very high risk, early within 24 hours for high risk, selective for low risk).
Diffuse ST depression in ≥6 leads, especially with ST elevation in aVR, is a marker of high risk and severe subendocardial ischemia. An immediate invasive strategy is indicated for hemodynamic instability, cardiogenic shock, life-threatening arrhythmias, refractory or ongoing ischemia, and other very high-risk NSTE-ACS criteria; otherwise, patients are managed according to the NSTE-ACS algorithm with an early or urgent strategy based on risk, without automatically equating it to STEMI.
Up-sloping depression during sinus tachycardia usually does not require emergency intervention, but the absence of pain and the physiological nature of tachycardia do not by themselves rule out ischemia — evaluate clinical presentation, dynamics, depression magnitude at the standard measurement point, and the cause of tachycardia, and repeat the ECG after rate correction. ST depression must not be interpreted in isolation from the clinical context: correlate with chest pain, serial ECG evolution, troponin levels, and echocardiography.
Common interpretation errors
- Measuring displacement arbitrarily within the ST segment rather than from the J point, or mixing up the measurement point for ACS (J point) versus exercise testing (60–80 ms after the J point)
- Ignoring depression morphology — treating up-sloping depression as definitively non-ischemic without considering clinical context and displacement magnitude
- Failing to account for tachycardia as a potential cause of false-positive up-sloping depression, without ruling out ischemia when symptoms persist
- Automatically equating diffuse depression with ST elevation in aVR to mandatory emergency coronary angiography without assessing hemodynamics and very high-risk criteria
- Interpreting ST depression in a patient taking digitalis as a sign of ischemia without considering the characteristic morphology and medical history
- Missing a posterior MI in the presence of isolated horizontal depression in V1–V3 without recording posterior leads V7–V9
- Using the PR segment as the isoelectric line when it is displaced (pericarditis, atrial infarction) without comparing it with the TP segment and other leads
1. Which ST-segment depression morphology has the lowest ischemic specificity?
Upsloping depression is often associated with tachycardia and is considered to have low specificity for ischemia, although it does not completely rule it out.
2. At which point is the depth of ST-segment depression measured in acute coronary syndrome?
In ACS criteria, new horizontal or downsloping ST depression ≥0.5 mm is evaluated specifically at the J-point, unlike exercise testing where it is measured 60–80 ms after it.
3. How should diffuse ST depression with ST elevation in aVR be interpreted in the presence of hemodynamic instability?
In the presence of hemodynamic instability, ongoing ischemia, or other very high-risk criteria, this pattern requires an immediate invasive strategy rather than routine management.
Frequently asked questions
Which ST depressions are dangerous and which are not?
Horizontal and downsloping ST depression are more suspicious for ischemia, especially if new, dynamic, and accompanied by symptoms, and require immediate evaluation based on the ACS clinical picture. Upsloping depression, particularly in tachycardia, usually has low specificity, but in the presence of persistent symptoms or significant displacement magnitude, ischemia must still be ruled out. It is important to remember that horizontal and downsloping depression are not specific without clinical context and the exclusion of secondary changes (LV hypertrophy, bundle branch blocks, digoxin).
How to differentiate ischemic ST depression from the digoxin effect?
The digoxin effect produces a characteristic "sagging" ST depression with a shortened QT interval, typically seen across many leads regardless of the clinical presentation. Ischemic depression is more often horizontal or downsloping, localized to the leads of the corresponding ventricular wall, and accompanied by chest pain or dynamic changes on serial ECGs.
Is ST depression dangerous by itself?
ST depression itself is an electrocardiographic sign, not a diagnosis. The risk level is determined by the underlying cause: ischemic depression in NSTE-ACS requires risk stratification and urgent management, whereas depression due to tachycardia or left ventricular hypertrophy does not require emergency measures.
What does widespread ST depression with ST elevation in aVR mean?
This is a high-risk marker that may indicate severe multivessel ischemia, left main coronary artery disease, or proximal LAD lesion. It is not an automatic indication for emergency coronary angiography in all patients: an immediate invasive strategy is needed for hemodynamic instability, ongoing ischemia, or other very high-risk criteria; otherwise, management follows the NSTE-ACS pathway.
What threshold of ST depression is considered significant?
For acute ischemic changes in ACS, the ESC guidelines define a new horizontal or downsloping ST depression of ≥0.5 mm at the J point in two contiguous leads. In stress testing, the classic threshold is ≥1 mm of horizontal or downsloping depression measured 60–80 ms after the J point and persisting for ≥0.08 s.
ECG Course
Interpretation from basics to myocardial infarction — learn to read any ECG using a systematic algorithm.
- Video lessons and theory for every topic
- Simulator case studies under every lesson
- Unlimited ECG simulator practice
- Study guide: "All ECGs in 25 minutes"
ECG Strip Simulator
ECG, radiology, histology, pathomorphology, pharmacology — thousands of flashcards with detailed explanations.
- Real ECG strips, not textbook drawings
- Instant answers and explanations
- Streaks and progress tracking in your dashboard
Related terms
More in the section «Basics: waves, intervals, axes»
Sources
- Goldberger's Clinical Electrocardiography, 9th ed.
- Surawicz, Knilans. Chou's Electrocardiography in Clinical Practice, 6th ed.
- ESC Guidelines for the management of acute coronary syndromes, 2023
- AHA/ACCF/HRS Recommendations for the Standardization and Interpretation of the ECG, 2009
Educational material for medical students and physicians. Does not replace clinical guidelines and physical examination; the ECG must always be interpreted in conjunction with the clinical picture.