ECG criteria
- In I, II, aVL, aVF, V4–V6: a Q wave with a duration of ≥0.03 s (≥0.75 mm at 25 mm/s) and a depth of ≥1 mm, or a QS complex — the criterion is evaluated in two contiguous leads of the same anatomical zone
- In V2–V3: a Q wave with a duration of ≥0.02 s (AHA/ACCF/HRS 2009), or a QS complex — in the presence of the corresponding pattern in two contiguous leads; a stricter threshold of ≥0.04 s is found in certain older classifications and is not a current standard
- Historical additional sign: Q depth ≥25% of the R wave amplitude in the same complex — used as an auxiliary feature, does not replace the main duration and depth criterion
- QRS fragmentation or notching of the initial part of Q may be an additional sign of scar tissue involvement, but does not replace standard criteria and imaging data
- A pathological Q must be recorded in two contiguous leads of the same anatomical zone (II+III+aVF, I+aVL, V5+V6, V2+V3)
- A QS complex (absence of R) in V2–V3 with a correct recording and presence in two contiguous leads may meet the criterion for a pathological Q
- An isolated QS in a single lead V1 is often a normal variant; any finding in V1–V2 requires checking electrode placement and assessing the clinical context
- Exclude non-pathological causes of a similar pattern: LBBB, WPW, HCM, cardiac rotation, dextrocardia
What it looks like on ECG
A pathological Q wave is the initial negative deflection of the QRS, the criteria for which depend on the lead. In most leads (I, II, aVL, aVF, V4–V6), a Q wave is considered pathological if its duration is ≥0.03 s (≥0.75 mm at 25 mm/s) and depth is ≥1 mm, or if a QS complex is present; this combination, rather than an alternative of one sign over another, is evaluated in two contiguous leads of the same zone. In V2–V3, the duration threshold is lower: according to AHA/ACCF/HRS 2009 and the universal definition of MI, a Q wave with a duration of ≥0.02 s or a QS complex, confirmed in two contiguous leads. The stricter threshold of ≥0.04 s belongs to certain older classifications and is not considered an equivalent modern alternative criterion.
To diagnose myocardial infarction, changes are sought in two contiguous leads of the same anatomical zone:
| Zone | Leads |
|---|---|
| Septal (low specificity) | V1–V2 |
| Anterior | V3–V4 |
| Lateral | I, aVL, V5–V6 |
| Inferior | II, III, aVF |
Lead V1 is indicated as having low specificity: a pathological Q wave in it is not an independent standard diagnostic criterion, and a QS in V1 is often a normal variant, therefore findings in V1–V2 are evaluated only together with V2–V3 criteria in two contiguous leads, taking into account recording quality and clinical presentation. For posterior infarction, reciprocal changes in V1–V3 are evaluated: horizontal ST depression, tall R, and positive T; if suspected, additional leads V7–V9 are used, where ST elevation ≥0.5 mm (in some guidelines ≥1 mm, adjusted for sex) is considered diagnostically significant. An isolated Q in III or aVF without changes in contiguous leads has low specificity and is usually not a basis for diagnosing infarction. Notching or slurring of the initial part of Q is an additional, but not an independent argument in favor of a true scar rather than a positional artifact.
Real ECGs: 8 examples
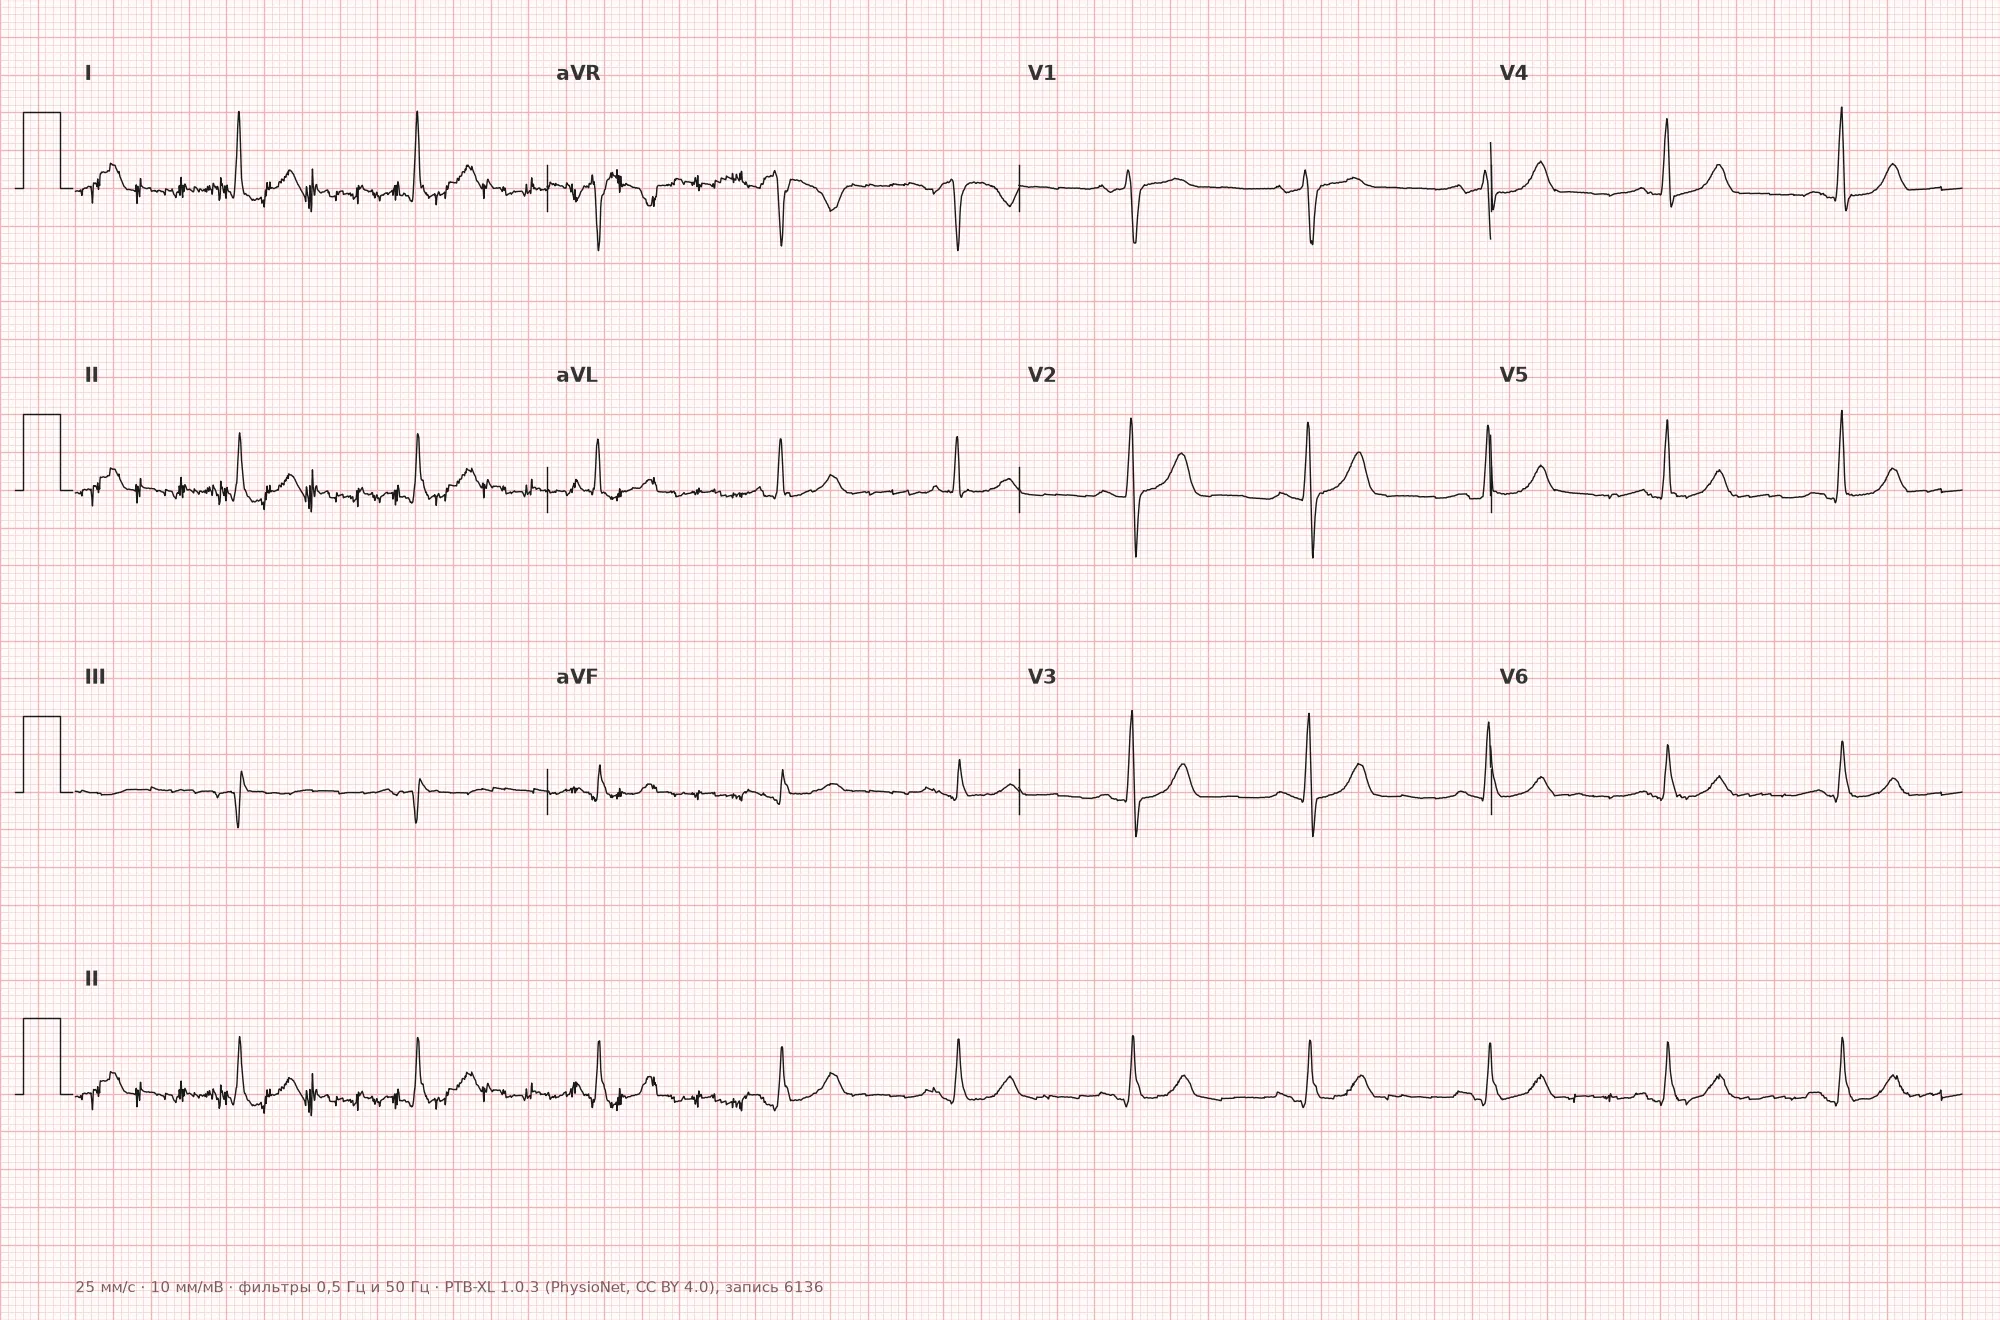
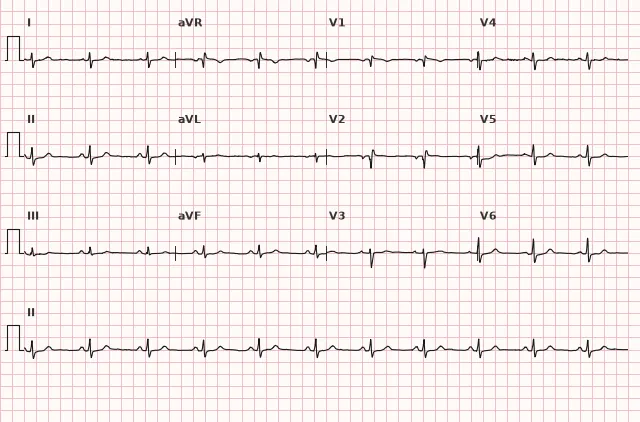
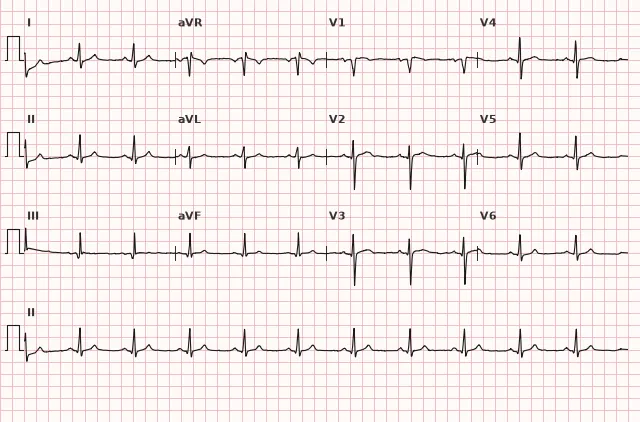
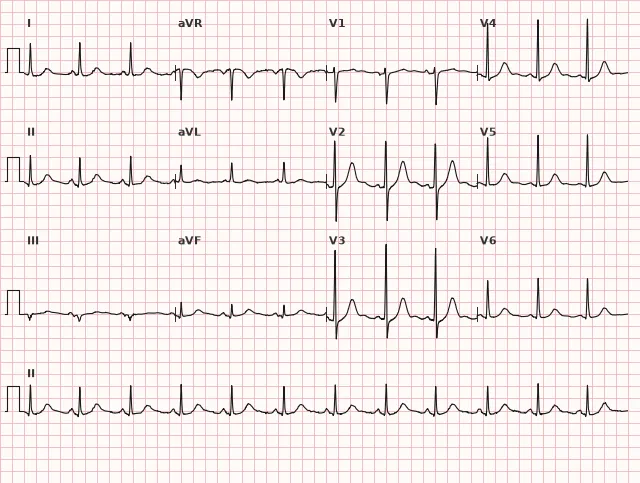
ECG from the open PTB-XL dataset (Wagner P. et al., Scientific Data, 2020; PhysioNet), CC BY 4.0 license. Rendering by WhiteCoat Pro.
Mechanism
The Q wave reflects the first 0.02–0.04 s of ventricular depolarization — usually the depolarization of the interventricular septum from left to right, which produces a small normal septal Q in I, aVL, V5–V6. A pathological Q occurs when the net depolarization vectors change due to the loss or alteration of electrically active myocardium. If a myocardial segment is necrotic (post-infarction scar) or replaced by fibrous tissue, the electrical vector from this zone is absent — instead, a vector from the opposite (healthy) wall directed away from the electrode is recorded. This forms a deep and wide negative wave in the leads facing the necrotic zone — the so-called "electrical window". Pathological Q waves are not a direct marker of transmural necrosis alone: they can be observed in small or non-transmural infarctions, as well as in other processes altering depolarization vectors.
Causes
- Prior myocardial infarction with scar formation (most common cause)
- Acute STEMI in the evolved stage (appears hours to days from onset)
- Left ventricular aneurysm (persistent ST elevation + pathological Q)
- Hypertrophic cardiomyopathy (deep, narrow "pseudoinfarct" Q waves in inferolateral leads)
- Myocarditis with pronounced fibrosis
- Infiltrative cardiomyopathies (amyloidosis, cardiac sarcoidosis)
- Left bundle branch block, WPW with a specific accessory pathway location (mimic)
- Pronounced cardiac rotation, dextrocardia, severe COPD/emphysema (positional pseudo-Q waves)
- Pneumothorax, Takotsubo cardiomyopathy (temporary Q waves)
Differential diagnosis
- Normal septal Q (I, aVL, V5–V6) — narrow (<0.03 s), low amplitude, and usually <25% of the amplitude of the subsequent R; there is no rigid universal limit in millimeters, evaluate the combination of duration, amplitude, and ratio to R in the context of the lead.
- QS in V1 — an isolated QS in a single lead V1 is frequently a normal variant, interpreted taking into account electrode placement, clinical presentation, and other signs.
- HCM — a deep, narrow Q in the inferior and lateral leads against the background of hypertrophy signs; various ST-T changes are possible, including deep negative T waves and ST depression — their presence does not exclude the pseudoinfarct nature of Q in HCM; the diagnosis is confirmed by echocardiography or cardiac MRI.
- WPW — a negative delta wave can mimic a Q wave; look for a shortened PQ and the delta wave itself on the upstroke of R.
- LBBB — a wide QRS with the absence of a normal Q in V5–V6 and a notched R; diagnosis of infarction requires Sgarbossa criteria (modified).
- Positional/respiratory pseudo-Q waves in III with a vertical heart axis — respiratory and positional influences can reduce or alter their prominence, but are not obliged to completely eliminate the Q wave.
- Takotsubo and myocarditis — the Q wave may be reversible, unlike a persistent post-infarction scar.
Clinical significance and management
A pathological Q wave by itself is not an emergency condition, but it indicates structural myocardial damage — current or past. In acute coronary syndrome, the appearance of a Q wave indicates necrosis that has already begun to form, and should not delay reperfusion strategy in STEMI. In an asymptomatic patient, a pathological Q wave without a history is a reason to clarify the history of past MI, refer for echocardiography (assessment of regional contractility, aneurysm, LV function) and, if necessary, for coronary angiography or contrast-enhanced cardiac MRI (scar visualization). The Q wave is correlated with the clinical presentation, ST-T dynamics, echocardiography/MRI results, and coronary anatomy: an isolated finding in an asymptomatic young patient requires ruling out HCM and other cardiomyopathies rather than automatic interpretation as an "old infarction". The topographical assignment of the Q wave is tentative and depends on anatomical variants, infarct size, cardiac position, and other changes.
Common interpretation errors
- Diagnosing infarction based on a Q wave in a single lead without checking contiguous leads.
- Mistaking a normal septal Q in V5–V6 for a pathological one without assessing width and ratio to R.
- Using the universal rule "≥0.03 s and ≥1 mm" for V2–V3 instead of the separate duration criterion for these leads.
- Failing to account for technical causes (incorrect placement of V1–V2 electrodes, baseline drift) that distort the initial part of the QRS.
- Applying standard Q criteria in LBBB or WPW, where separate algorithms are required (Sgarbossa criteria, delta wave analysis).
- Considering QS in V1–V2 as a reciprocal sign of posterior infarction — posterior infarction is suspected with horizontal ST depression, tall R, and positive T in V1–V3, and confirmation is evaluated in V7–V9 by ST elevation.
1. Which combination of features is used to diagnose a pathological Q wave in most leads according to modern criteria?
In most leads (I, II, aVL, aVF, V4–V6), a combination is used: width ≥0.03 s, depth ≥1 mm, QS complex, or presence of the sign in two contiguous leads. Separate duration thresholds are applied for V2–V3.
2. In which chest leads is a lower duration threshold used for a pathological Q wave?
In V2–V3, the AHA/ACCF/HRS 2009 criterion for a pathological Q wave is a duration ≥0.02 s or a QS complex in two contiguous leads, which is lower than the threshold for most other leads.
3. Which condition can produce a deep yet narrow "pseudoinfarct" Q wave in the inferolateral leads without a prior myocardial infarction?
In HCM, marked septal hypertrophy creates deep, narrow Q waves in the inferior and lateral leads mimicking infarction changes, while various ST-T abnormalities may also be present without excluding this pattern.
Frequently asked questions
Which Q wave is considered pathological?
Criteria depend on the lead. In most leads (I, II, aVL, aVF, V4–V6), the criteria are duration ≥0.03 s and depth ≥1 mm, or a QS complex, in two contiguous leads. A separate criterion is used in V2–V3: duration ≥0.02 s (AHA/ACCF/HRS 2009) or a QS complex, also in two contiguous leads; a threshold of ≥0.04 s is found in some older classifications. The historical Q/R ≥25% criterion is used as an additional, but not universal, marker.
Is a pathological Q wave dangerous?
The wave itself is not dangerous, but it is a marker of structural myocardial damage—most commonly a prior myocardial infarction. The risk is determined by the underlying disease: scar size, left ventricular function, and the risk of arrhythmias and heart failure.
How to distinguish a pathological Q from a normal septal Q?
A normal septal Q in I, aVL, V5–V6 is narrow (<0.03 s), of low amplitude, and usually <25% of the R-wave amplitude, without notches. A pathological Q exceeds the duration and depth criteria for its lead and is typically accompanied by other scar signs—such as poor R-wave progression, ST-T changes, or is recorded in two contiguous leads.
Does a pathological Q wave disappear after myocardial infarction?
In most cases, the Q wave persists for life as a scar marker, but in some patients (especially with small non-transmural necrosis or successful early reperfusion), the Q wave may decrease or disappear within weeks to months.
Can the location of a myocardial infarction be determined from the Q wave?
Topographical localization is approximate and depends on anatomical variations, infarct size, heart position, and other changes: Q waves in II, III, aVF indicate the inferior wall; in V3–V4—the anterior wall; in I, aVL, V5–V6—the lateral wall. Posterior infarction is suspected in the presence of horizontal ST depression, tall R wave, and upright T wave in V1–V3; confirmation is assessed in V7–V9 by ST elevation. Correlation with ST-T dynamics, echocardiography/MRI, and coronary anatomy is required.
ECG Course
Interpretation from basics to myocardial infarction — learn to read any ECG using a systematic algorithm.
- Video lessons and theory for every topic
- Simulator case studies under every lesson
- Unlimited ECG simulator practice
- Study guide: "All ECGs in 25 minutes"
ECG Strip Simulator
ECG, radiology, histology, pathomorphology, pharmacology — thousands of flashcards with detailed explanations.
- Real ECG strips, not textbook drawings
- Instant answers and explanations
- Streaks and progress tracking in your dashboard
Related terms
More in the section «Basics: waves, intervals, axes»
Sources
- Goldberger A. Clinical Electrocardiography: A Simplified Approach
- Surawicz B., Knilans T. Chou's Electrocardiography in Clinical Practice
- AHA/ACCF/HRS Recommendations for the Standardization and Interpretation of the ECG, 2009
- Orlov V.N. Guide to Electrocardiography
Educational material for medical students and physicians. Does not replace clinical guidelines and physical examination; the ECG must always be interpreted in conjunction with the clinical picture.