ECG criteria
- ST-segment elevation is measured at the J point (the onset of the ST segment) relative to the isoelectric line (TP segment or PQ level)
- In leads other than V2–V3: ST elevation ≥1 mm (0.1 mV) in two contiguous leads
- In V2–V3: ST elevation ≥2 mm in men ≥40 years old, ≥2.5 mm in men <40 years old, ≥1.5 mm in women (some sources provide thresholds without age breakdown — see the «What it looks like» section)
- ST-segment morphology is convex (dome-shaped, «cat's back») or obliquely ascending, merging with the T wave — an ancillary sign, not used to confirm or exclude infarction
- Reciprocal ST depression in leads opposite to the injury zone is frequently present, but its absence does not rule out acute coronary occlusion
- Concomitant hyperacute (tall, wide) T waves in the same leads at the earliest stage
- Temporal dynamics: ST elevation may increase, then decrease with the formation of a Q wave and/or negative T wave — this sequence supports the diagnosis of acute ischemia, but is not mandatory and is evaluated alongside clinical presentation, serial ECGs, and troponin
- Binding to two contiguous anatomically related lead groups: septum V1–V2, anterior V3–V4, lateral I, aVL, V5–V6, inferior II, III, aVF — wall and arterial localization is approximate and does not always correspond to a single coronary territory
What it looks like on ECG
The ST segment is elevated above the isoelectric line; its shape is most often upwardly convex («cat's back», «tombstone» in extreme cases) or obliquely ascending transitioning into a tall T wave. The change is often restricted to leads reflecting a single left ventricular wall and is frequently accompanied by reciprocal ST depression in opposite leads, but this is not a mandatory condition: in pericarditis, the elevation is diffuse, while in right ventricular infarction, posterior infarction, and certain occlusions, the distribution may be atypical, and the absence of reciprocal changes does not rule out acute coronary occlusion.
ST-elevation thresholds (AHA/ACCF/HRS 2009, ESC):
| Leads | Men ≥40 years old | Men <40 years old | Women |
|---|---|---|---|
| V2–V3 | ≥2 mm | ≥2.5 mm | ≥1.5 mm |
| Other leads | ≥1 mm | ≥1 mm | ≥1 mm |
In various guidelines and textbooks, thresholds for V2–V3 may be stated without age breakdown (simply ≥2 mm for men, ≥1.5 mm for women) — this discrepancy is due to the year and version of the document, and both variants are encountered in practice.
Measurements are performed at the J point relative to the TP segment level of the preceding complex (at tachycardia, relative to the PQ level). At an early stage, injury is often preceded or accompanied by hyperacute T waves — tall, wide, symmetrical. For the inferior wall, the ratio of ST elevation in III being higher than in II, along with depression in I and aVL, are ancillary signs that support the diagnosis of true inferior injury, but they are not an independent reliable criterion and do not replace the assessment of clinical presentation and dynamics. For the anterior wall, it is important to exclude De Winter's pattern and Wellens' syndrome — variants with distinct ST-T dynamics.
Real ECGs: 8 examples
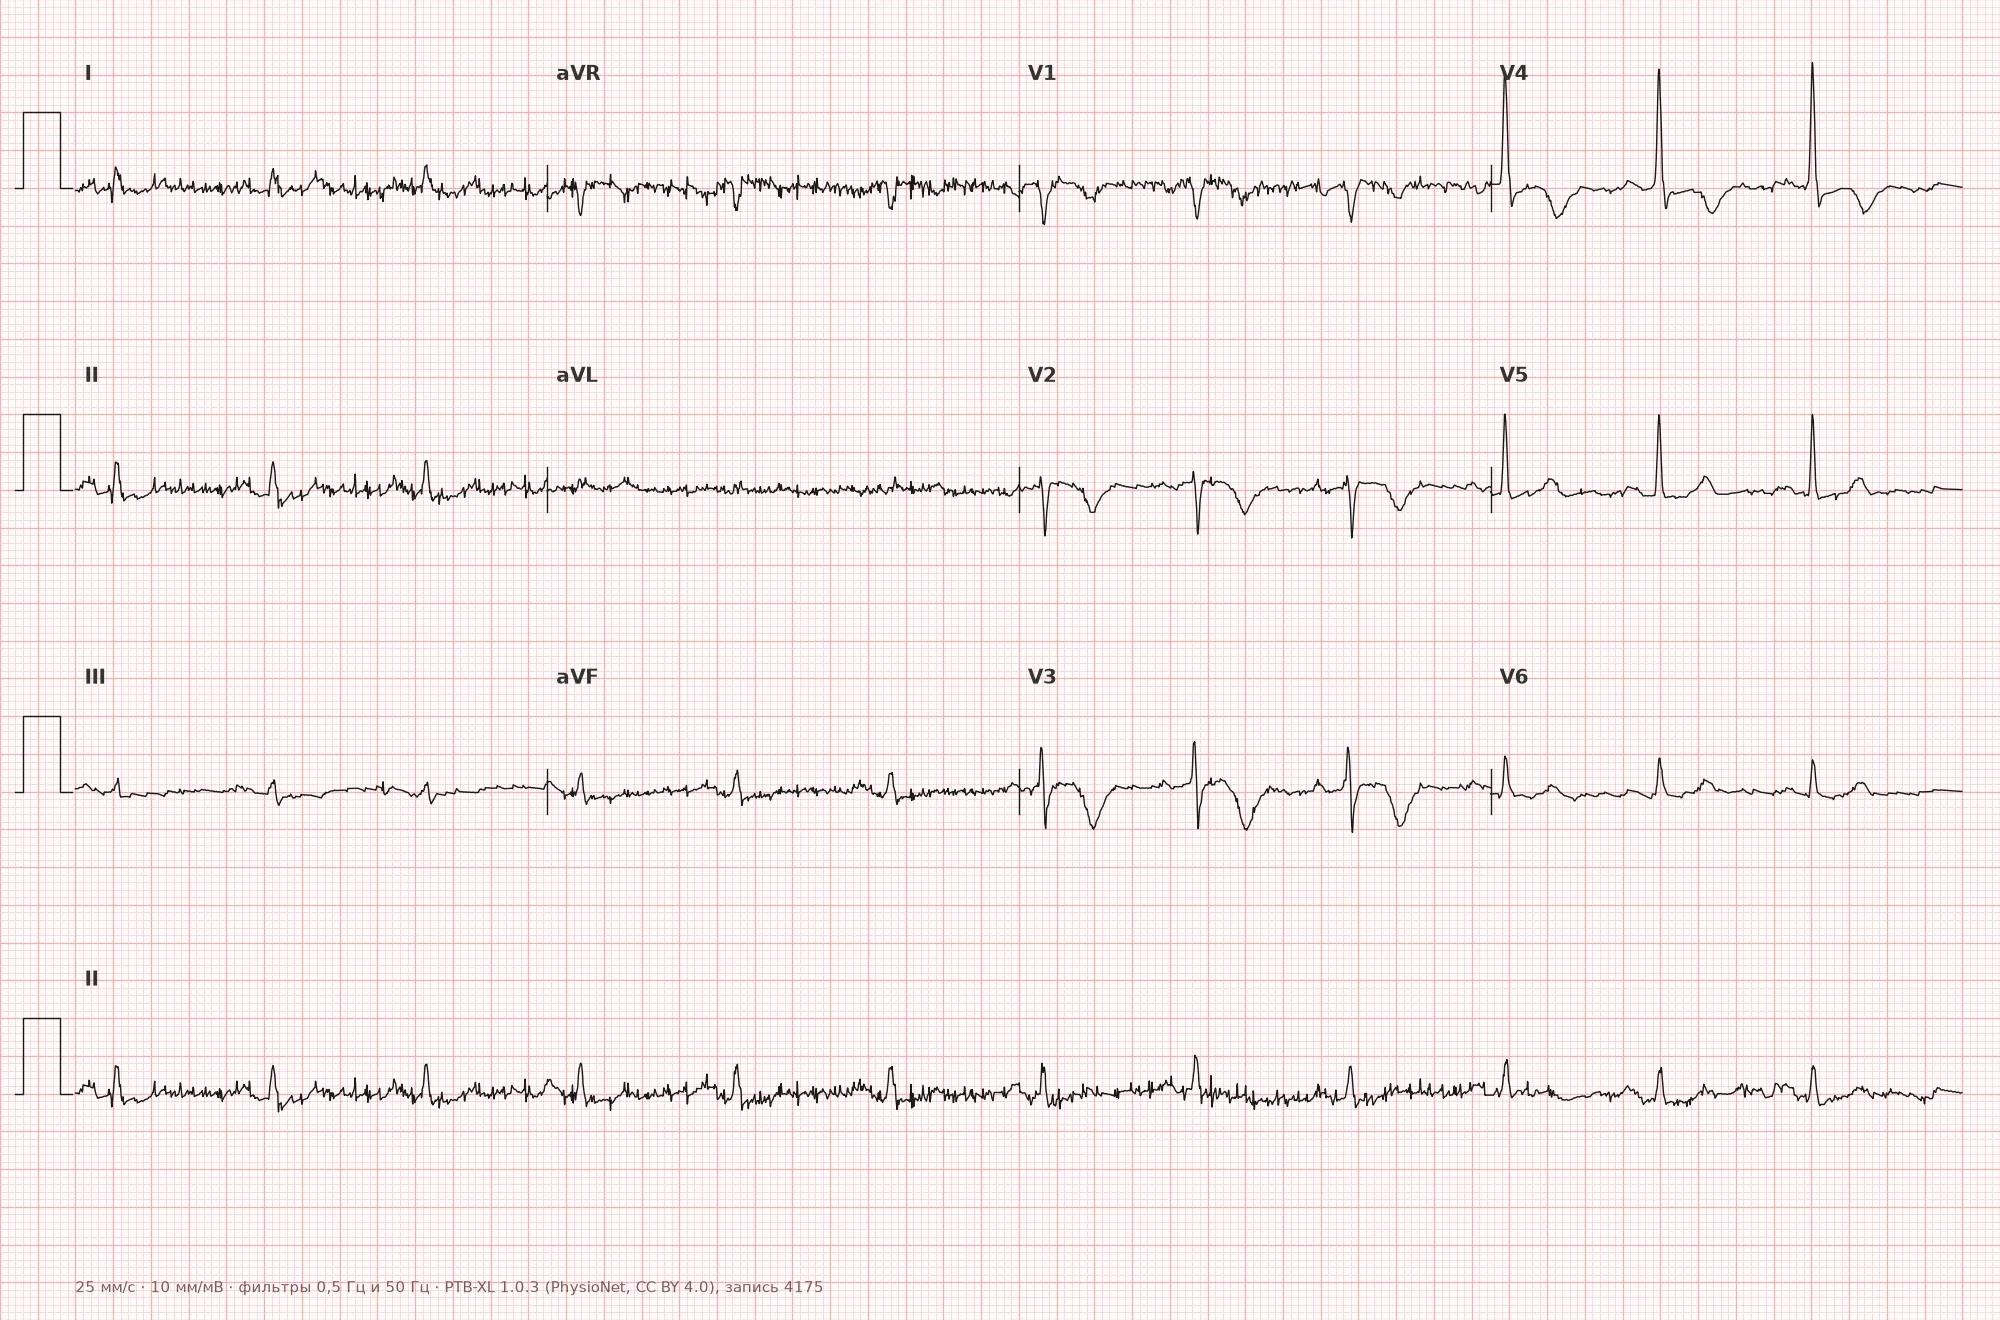
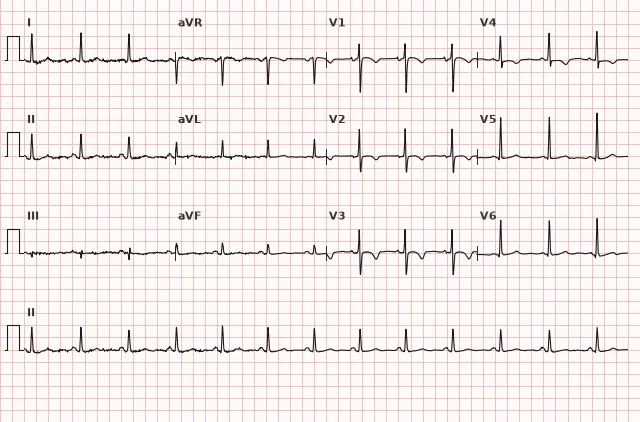
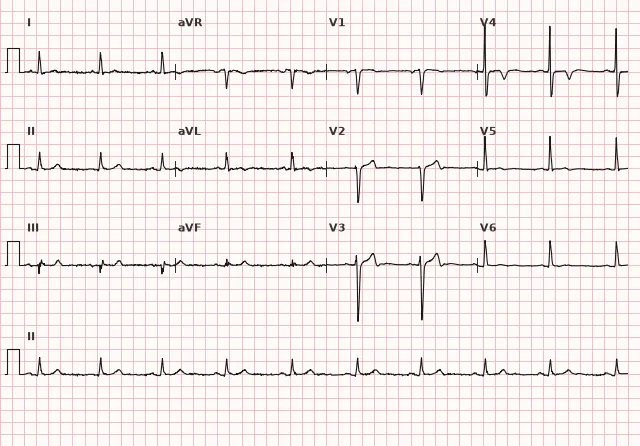
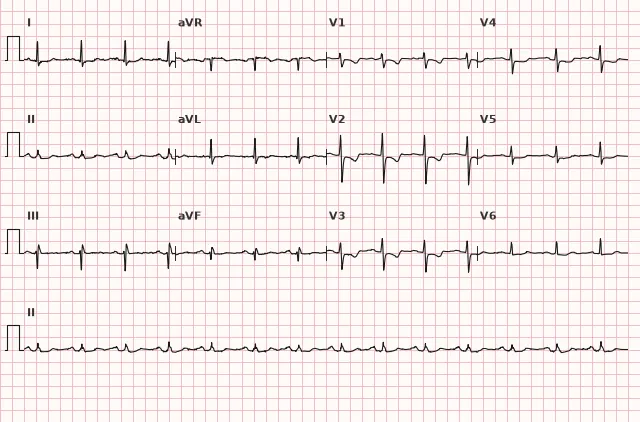
ECG from the open PTB-XL dataset (Wagner P. et al., Scientific Data, 2020; PhysioNet), CC BY 4.0 license. Rendering by WhiteCoat Pro.
Mechanism
Upon abrupt cessation of coronary blood flow, ischemia in the classical model first affects the subendocardial layers of the myocardium as the most sensitive to hypoxia, then spreads transmurally, involving the subepicardial layer. This is a simplified historical scheme: the actual degree and extent of ischemia do not always transition sequentially from subendocardial to transmural, but depend on occlusion time, collateral blood flow, zone size, and reperfusion. ST elevation is not a direct measure of ischemia depth or the volume of salvaged myocardium.
Injured cells are partially depolarized at rest and lose part of their resting potential, which creates a potential difference in diastole between the injury zone and the unaffected myocardium. This difference shifts the isoelectric line and forms a visible ST-segment elevation in leads facing the affected wall from the outside (epicardially); reciprocal changes occur in leads oriented oppositely to the injury vector and support the localized nature of acute ischemia, but their absence does not rule out occlusion.
Causes
- Acute coronary artery occlusion in STEMI (atherothrombosis)
- Coronary artery spasm (Prinzmetal's angina)
- Coronary embolism, coronary artery dissection
- Complications of percutaneous interventions (acute reocclusion, dissection)
- Rarely — pronounced coronary vasospasm secondary to intoxications (e.g., cocaine)
- Severe multivessel subendocardial ischemia typically causes diffuse ST depression and ST elevation in aVR rather than localized STEMI-like ST elevation; localized elevation in multivessel disease requires a separate search for acute occlusion
Differential diagnosis
- Pericarditis: ST elevation is diffuse, predominantly upwardly concave, not restricted to a single coronary territory, in many leads without reciprocal depression (except aVR and often V1), frequently with PR-segment depression
- Early repolarization syndrome: ST elevation mainly in precordial leads, stable for years, without reciprocal changes and without dynamics
- Left ventricular aneurysm: persistent ST elevation for months and years after infarction, usually with a pathological Q wave in the same leads, without acute dynamics
- ST elevation in left bundle branch block: evaluated using modified Sgarbossa (Smith) criteria rather than absolute elevation magnitude
- De Winter waves: ST depression at the J point with a tall pointed T wave in precordial leads — an equivalent of occlusion without overt ST elevation
- Brugada syndrome type 1: dome-shaped ST elevation in right precordial leads V1–V2 (sometimes involving V3), especially with high lead placement, with characteristic morphology and subsequent negative T wave; not associated with ischemia
Clinical significance and management
ST elevation meeting the criteria in two contiguous leads, in the presence of a compatible clinical picture (chest pain, ischemia equivalents), is interpreted as STEMI and requires an immediate reperfusion strategy. Primary PCI is preferred if the time from STEMI diagnosis to reperfusion (performing PCI, crossing the lesion with a guidewire) can be kept to ≤120 minutes; for patients who are already in or near a PCI center, the target interval is shorter. If primary PCI within 120 minutes of diagnosis is unachievable and symptoms last less than 12 hours without contraindications, immediate fibrinolysis followed by a pharmacoinvasive strategy or rescue PCI in case of failed thrombolysis is indicated.
Signs of probable acute coronary occlusion without classical ST elevation are evaluated separately: De Winter waves and the Aslanger pattern are described patterns of probable occlusion requiring urgent evaluation, but they are not included in the formal ESC STEMI criteria table. When posterior MI is suspected, additional leads V7–V9 are recorded: ST elevation in these leads is generally considered significant from ≥0.5 mm in two contiguous posterior leads, although specific thresholds and their specificity vary across documents; isolated ST depression in V1–V3 with elevation in these posterior leads is a recognized occlusion equivalent. For all these patterns, the urgency of the invasive strategy is determined not by the pattern itself formally, but by the entire clinical picture — ongoing ischemia, hemodynamic instability, ECG dynamics. ST depression with elevation in aVR in multivessel disease is nonspecific and may reflect global subendocardial ischemia; this requires urgent evaluation, but is not a specific sign of left main coronary artery disease — tactics are determined by clinical presentation, hemodynamics, and ECG dynamics rather than this single sign.
The physician should: record a 12-lead ECG within the first 10 minutes of contact; when inferior MI, hypotension, «clear» lungs, or suspected right ventricular involvement is present, acquire right chest leads V3R–V4R (mainly V4R); when ST depression is present in V1–V3, acquire posterior leads V7–V9; repeat ECGs serially; correlate findings with troponin and clinical presentation; and not delay reperfusion while waiting for laboratory markers.
Common interpretation errors
- Evaluating ST-segment elevation not at the J-point, but at the midpoint of the segment or at the T-wave peak, overestimates or distorts the degree of elevation
- Forgetting about different sex- and age-specific thresholds for V2–V3, thereby misinterpreting physiological male ST elevation as pathology in a young man
- Assuming that the absence of reciprocal ST depression rules out acute coronary occlusion — this only decreases the probability but does not exclude injury
- Confusing ST elevation in left bundle branch block with ischemic changes without applying Sgarbossa's criteria
- Failing to record posterior leads V7–V9 in the presence of ST depression in V1–V3, thereby missing a posterior myocardial infarction; failing to record right leads V3R–V4R in inferior MI or suspected right ventricular involvement
1. At which ECG point is the magnitude of ST-segment elevation measured?
The J-point is the junction between the QRS complex and the ST segment, which is the standard measurement point for ST elevation or depression.
2. Which feature supports the diagnosis of true subepicardial injury of the inferior wall, as opposed to benign ST elevation?
Reciprocal changes in leads opposite to the injury zone support the diagnosis of acute inferior injury and are typically absent in benign variants of ST elevation, although this is an auxiliary rather than an absolute sign.
3. What is the ST elevation threshold in leads V2–V3 applied for women according to the 2009 AHA/ACCF/HRS guidelines?
For women, the ST elevation threshold in V2–V3 is lower than for men, set at ≥1.5 mm, reflecting the physiologically smaller ST amplitude in women.
Frequently asked questions
How does subepicardial injury differ from ischemia on an ECG?
In classical terminology, T-wave changes and non-elevation ST depression are described as ischemia—a reversible repolarization abnormality—while ST elevation is described as injury. This is a historical simplification: ischemia can also cause transient ST elevation, and ST depression does not always signify myocardial ischemia specifically. ST elevation requires ruling out acute coronary occlusion, but does not diagnose infarction by itself.
Does ST elevation always mean myocardial infarction?
No. ST elevation can occur in pericarditis, early repolarization syndrome, left ventricular aneurysm, Brugada syndrome, and several other conditions. The diagnosis is established based on the combination of ST morphology, serial changes, reciprocal alterations, and the clinical picture.
How to differentiate ST elevation in inferior myocardial infarction from a benign normal variant?
In true inferior injury, ST elevation in lead III is often greater than in lead II, and reciprocal ST depression in leads I and aVL is frequently present—these features support the diagnosis, but are not mandatory in all cases. The final determination relies on the clinical presentation, serial ECGs, and evaluation of right and posterior leads.
Do we need to wait for troponin results before initiating reperfusion therapy in ST elevation?
No. When STEMI ECG criteria and compatible clinical findings are present, reperfusion strategy should be initiated immediately without waiting for troponin results.
What to do if ST elevation is present, but only in a single lead?
The STEMI criterion requires ST elevation in two contiguous leads. An abnormality in a single lead does not confirm injury by itself—adjacent leads, serial changes, and reciprocal alterations must be sought.
ECG Course
Interpretation from basics to myocardial infarction — learn to read any ECG using a systematic algorithm.
- Video lessons and theory for every topic
- Simulator case studies under every lesson
- Unlimited ECG simulator practice
- Study guide: "All ECGs in 25 minutes"
ECG Strip Simulator
ECG, radiology, histology, pathomorphology, pharmacology — thousands of flashcards with detailed explanations.
- Real ECG strips, not textbook drawings
- Instant answers and explanations
- Streaks and progress tracking in your dashboard
Related terms
More in the section "Ischemia and Myocardial Infarction"
Sources
- Goldberger A.L. Clinical Electrocardiography: A Simplified Approach
- Surawicz B., Knilans T. Chou's Electrocardiography in Clinical Practice
- AHA/ACCF/HRS Recommendations for the Standardization of ECG, 2009
- ESC Guidelines for the management of acute coronary syndromes, 2023
Educational material for medical students and physicians. Does not replace clinical guidelines and physical examination; the ECG must always be interpreted in conjunction with the clinical picture.