ECG criteria
- ST elevation $\ge$ 1 mm in two contiguous limb leads (at the J point)
- ST elevation in V2–V3: $\ge$ 2 mm in men $\ge$ 40 years old, $\ge$ 2.5 mm in men < 40 years old, $\ge$ 1.5 mm in women (sex and age criteria vary across sources—both variants from ECG standardization guidelines are provided)
- Possible hyperacute phase patterns: upwardly convex ST shape («tombstone») or tall hyperacute T wave; these are not independent diagnostic criteria, but signs evaluated alongside clinical presentation and dynamics
- Reciprocal ST depression in leads opposite to the elevation zone (e.g., depression in II, III, aVF during elevation in I, aVL)
- Pathological Q wave or QS complex in two contiguous leads: in V2–V3 — Q duration $\ge$ 0.02 s or any QS complex (depth criterion does not apply here); in I, II, aVL, aVF, V4–V6 — Q width $\ge$ 0.03 s and depth $\ge$ 1 mm, or a QS complex; a Q wave is not mandatory in acute MI, and its absence does not rule out infarction
- T-wave dynamics: often tall hyperacute $\to$ inversion $\to$ gradual normalization, though the course is not strictly predictable
- New or presumed new horizontal or downsloping ST depression $\ge$ 0.5 mm in two contiguous leads (at the J point or 60–80 ms after it) — a sign of ischemia in NSTE-ACS; the diagnosis is established in conjunction with clinical presentation and troponin levels
- Leads are grouped by wall: septum V1–V2, anterior V3–V4, lateral I, aVL, V5–V6, inferior II, III, aVF, posterior V7–V9
What it looks like on ECG
Acute coronary occlusion produces a typical but variable sequence of changes in the leads corresponding to the affected artery's supply area.
| Grade | T wave | ST segment | Q wave |
|---|---|---|---|
| Hyperacute (minutes-hours) | often tall, hyperacute | begins to elevate | absent |
| Acute (hours-days) | usually begins to invert | elevation is maximal, shape is often convex | may appear |
| Subacute (days-weeks) | often negative, deep | returns toward the isoelectric line | may persist, diminish, or disappear |
| Chronic (scar) | may normalize or remain altered | usually on the isoelectric line | may persist, diminish, or disappear |
This diagram describes a typical, but not obligatory or strictly sequential course: the T wave may invert later than usual, remain positive, or re-pseudonormalize, while the Q wave may fail to form, diminish over time, or disappear. The diagnosis of a specific stage is always refined based on clinical presentation, history, and previous tracings.
ST elevation is measured at the J point relative to the PR or TP segment, in two contiguous leads of the same wall. In inferior MI (II, III, aVF), reciprocal depression is frequently present in I and aVL; in anterior MI, reciprocal changes in the inferior leads are less common and less specific. Posterior MI is seen as a mirror image in V1–V3 as ST depression and a tall R wave, and is directly confirmed by ST elevation in V7–V9. In diffuse ischemia of multiple vascular territories (e.g., left main coronary artery disease or multivessel disease), diffuse ST elevation in aVR with diffuse ST depression in other leads may occur—this is a high-risk pattern requiring urgent clinical evaluation, but it is not inherently equivalent to STEMI nor specific solely to left main occlusion.
Real ECGs: 8 examples
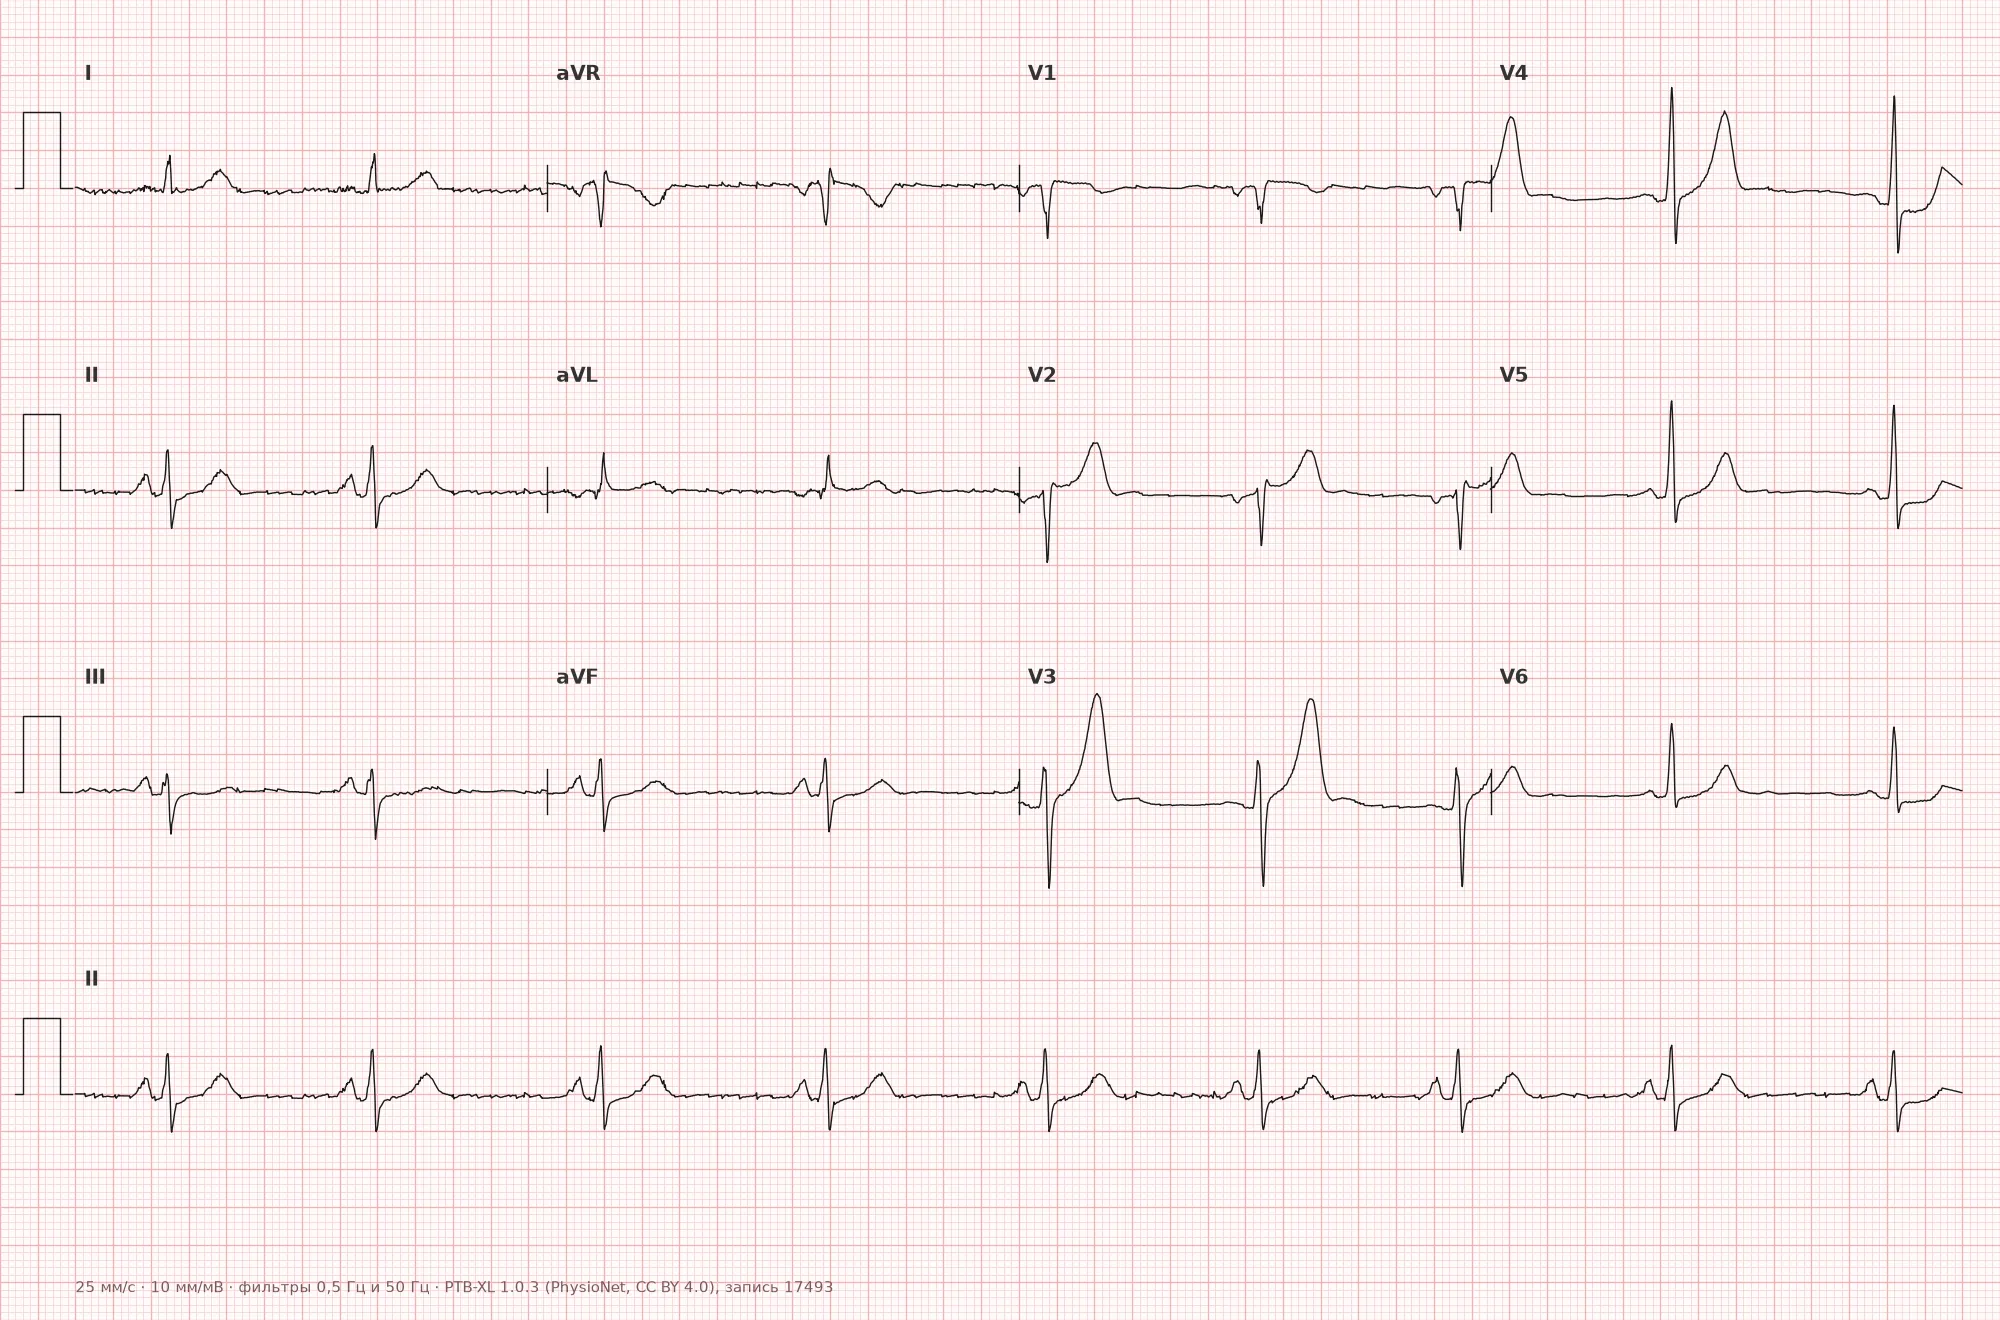
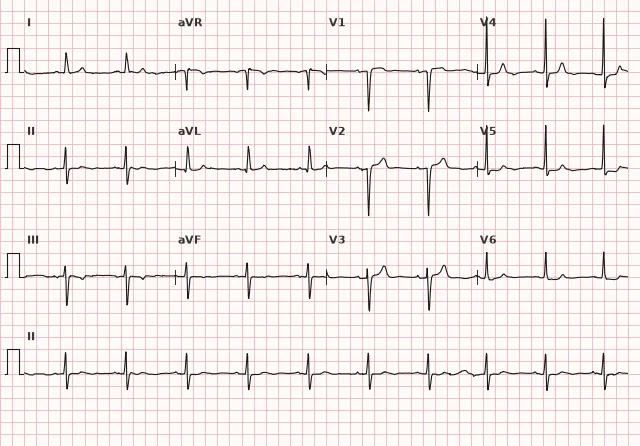
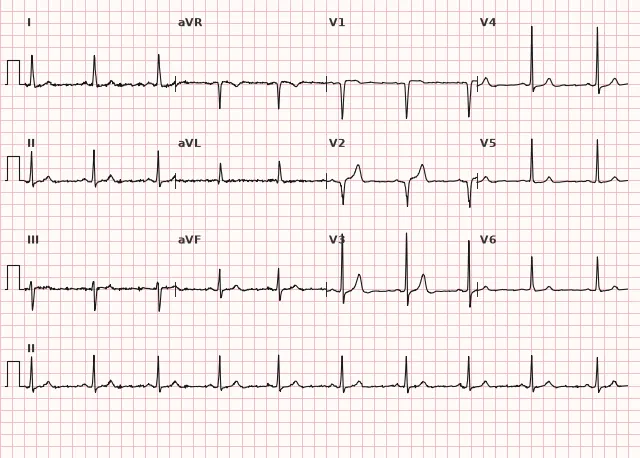
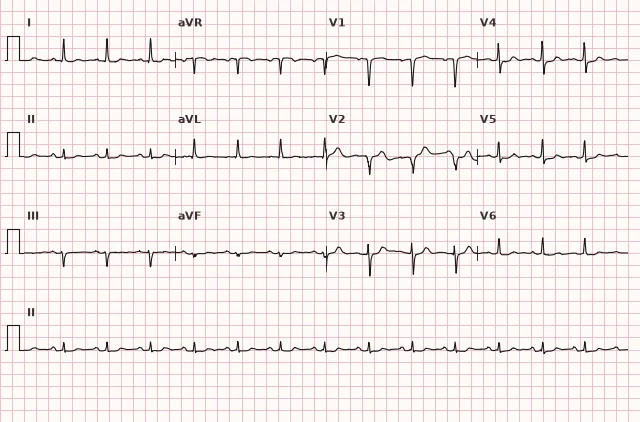
ECG from the open PTB-XL dataset (Wagner P. et al., Scientific Data, 2020; PhysioNet), CC BY 4.0 license. Rendering by WhiteCoat Pro.
Mechanism
Acute coronary occlusion causes injury and ischemia of the ventricular wall, shifting the injury vector toward the epicardium of the affected area — on the ECG, this produces ST-segment elevation in the facing leads and reciprocal depression in the opposite ones. ST elevation is most commonly associated specifically with acute occlusion and an epicardial/transmural nature of injury, but ECG sensitivity is limited: occlusion does not always manifest with classical ST elevation, and some occlusive infarctions present with other patterns or a nearly normal tracing. When a portion of cardiomyocytes dies, the myocardial segment becomes electrically «silent», and the depolarization vector points away from the necrotic zone — a pathological Q wave is formed. However, a Q wave does not prove transmural necrosis: it can also form in non-ST-segment elevation myocardial infarction, depends on the size and location of the lesion, and its absence does not rule out necrosis. Subendocardial ischemia without marked transmural injury typically manifests as ST depression and/or T-wave inversion — this picture is typical for NSTE-ACS, though exceptions do occur.
Causes
- Atherosclerotic plaque rupture with coronary artery thrombosis (main cause, type 1 MI)
- Coronary spasm (Prinzmetal's angina)
- Coronary artery embolism
- Coronary artery dissection (including spontaneous, SCAD)
- Severe mismatch between oxygen demand and supply (type 2 MI) — severe anemia, hypotension, tachyarrhythmia, hypoxia; regarded as infarction if acute MI criteria are met (troponin dynamics with clinical or ECG signs of ischemia), otherwise classified as acute myocardial injury without MI
- Multivessel disease or left main coronary artery occlusion
Differential diagnosis
- Pericarditis: diffuse ST elevation in multiple leads, concordant with the T wave, PR depression; reciprocal ST depression is absent in most leads, except for typical ST/PR depression in aVR and occasionally in V1; pathological Q waves are absent
- Early repolarization syndrome: ST elevation with a J-point notch, stable pattern without evolution, more common in young individuals
- Left ventricular aneurysm: persistent ST elevation, often with a pathological Q wave, without evolution over weeks to months; diagnosis requires correlation with clinical presentation and imaging (echocardiography, MRI)
- Brugada pattern type 1: coved ST elevation $\ge$ 2 mm in V1–V2 followed by a negative T wave, sometimes visible only when recorded one or two intercostal spaces higher than the standard position; the saddleback pattern of type 2 is not a diagnostic sign of Brugada syndrome by itself
- Hyperkalemia: tall peaked T waves without typical ST dynamics, wide QRS, flattened P waves
- de Winter waves and true posterior MI: occlusion equivalents without classical ST elevation; in the presence of appropriate clinical symptoms, they require an immediate reperfusion strategy; Wellens' syndrome and the diffuse aVR pattern are high-risk findings indicating critical lesions (Wellens' — proximal LAD) and requiring urgent invasive evaluation, but they do not constitute grounds for an automatic STEMI declaration
Clinical significance and management
An ECG with ST elevation meeting STEMI criteria or with reliable occlusion equivalents (de Winter, true posterior MI with corresponding clinical symptoms) is an indication for immediate reperfusion. If primary PCI can be performed within the recommended time window (ideally within 120 minutes from diagnosis/first medical contact to balloon inflation), primary PCI is preferred. If this window cannot be met, and symptom duration is generally less than 12 hours with no contraindications, immediate fibrinolysis followed by a pharmacoinvasive strategy (early coronary angiography after thrombolysis) is considered. Wellens' patterns and diffuse ST elevation in aVR with depression in other leads are considered high-risk, requiring urgent clinical evaluation, serial ECGs, and generally emergent invasive coronary angiography, though without automatic equivalence to STEMI. In NSTE-ACS, management is determined by risk stratification: very high risk warrants an immediate invasive strategy (comparable in urgency to STEMI), high risk warrants an early invasive strategy (typically within 24 hours), and remaining patients undergo selective or delayed strategies based on further stratification; this is not equivalent to STEMI reperfusion, but urgency may remain high. ECGs should be serial, compared with previous tracings, and evaluated for reciprocal changes to confirm the authenticity of ST elevation.
Common interpretation errors
- Evaluating ST elevation without comparison to a prior ECG risks missing a chronic aneurysm or early repolarization as «normal for this patient»
- Ignoring reciprocal ST depression, which increases the diagnostic certainty of the finding
- Using the same Q and ST-elevation thresholds in V2–V3 without regard to sex, age, and special criteria for septal leads
- Interpreting diffuse ST depression with ST elevation in aVR as "nonspecific changes" without considering high-risk ischemia
- Missing a posterior MI due to the absence of ST elevation in standard 12 leads without recording V7–V9
- Automatically equating Wellens' syndrome or the aVR pattern to STEMI instead of urgent clinical and invasive evaluation
1. What ST-elevation threshold in limb leads is considered significant in two contiguous leads?
For limb leads, ST elevation ≥ 1 mm at the J point in two contiguous leads is considered significant.
2. Which ECG change is reciprocal in inferior myocardial infarction?
With ST elevation in the inferior leads (II, III, aVF), reciprocal ST depression in I and aVL is typical.
3. Which feature differentiates pericarditis from ST-elevation myocardial infarction?
Pericarditis produces diffuse, T-wave-concordant ST elevation; typical reciprocal depression in pericarditis is limited to aVR (sometimes V1), unlike localized infarction elevation with reciprocal changes in the opposite wall.
Frequently asked questions
How to distinguish the hyperacute stage of infarction from normal?
In the hyperacute stage, the T wave may become tall and broad (hyperacute) even before overt ST elevation, sometimes asymmetric, but this is an inconstant sign—it is not obligatory and does not always precede ST elevation. Against the background of a typical clinical presentation, such a finding requires a repeat ECG in a short time and comparison with previous tracings to confirm dynamic changes.
Is a pathological Q wave dangerous by itself?
A pathological Q or QS wave may indicate a prior or evolving infarction in the respective zone, but it is not a specific marker of transmural necrosis: it does not prove its extent and depth, and it may persist, decrease, or disappear over time. A Q wave by itself without acute ST-T changes and clinical symptoms does not require emergency action, but it is important as a history marker when assessing risk together with clinical findings, ST-T dynamics, troponin, and imaging.
Can myocardial infarction be diagnosed with a normal ECG?
Yes, in the earliest minutes of occlusion or with a small area of injury, the ECG may be normal. The diagnosis is made based on the combination of clinical presentation, ECG dynamics, and necrosis biomarkers, so a single normal tracing does not rule out ACS.
Why are the ST-elevation thresholds in V2–V3 different for men and women?
Healthy young men have a higher baseline ST amplitude in the right precordial leads; therefore, ECG standardization guidelines suggest a higher threshold for men, especially those under 40, and a lower threshold for women to avoid losing sensitivity and specificity.
How does the management of NSTE-ACS differ from STEMI?
In STEMI and confirmed occlusive equivalents, reperfusion is performed immediately within strict time frames (primary PCI or fibrinolysis if PCI is unavailable). In NSTE-ACS, management is determined by risk stratification: an immediate or early invasive strategy for high and very high risk, and a selective strategy for others, without being tied to "door-to-balloon" minutes.
ECG Course
Interpretation from basics to myocardial infarction — learn to read any ECG using a systematic algorithm.
- Video lessons and theory for every topic
- Simulator case studies under every lesson
- Unlimited ECG simulator practice
- Study guide: "All ECGs in 25 minutes"
ECG Strip Simulator
ECG, radiology, histology, pathomorphology, pharmacology — thousands of flashcards with detailed explanations.
- Real ECG strips, not textbook drawings
- Instant answers and explanations
- Streaks and progress tracking in your dashboard
Related terms
More in the section "Ischemia and Myocardial Infarction"
Sources
- Goldberger's Clinical Electrocardiography, latest edition
- AHA/ACCF/HRS Recommendations for the Standardization and Interpretation of the Electrocardiogram, 2009
- ESC Guidelines for the management of acute coronary syndromes, 2023
- Orlov V.N. Guide to Electrocardiography
Educational material for medical students and physicians. Does not replace clinical guidelines and physical examination; the ECG must always be interpreted in conjunction with the clinical picture.