ECG criteria
- ST elevation ≥ 1 mm in at least two of the leads II, III, aVF (inferior wall)
- ST in III higher than in II — increases the probability of right coronary artery occlusion
- Reciprocal ST depression in I and aVL in inferior wall involvement
- In V1–V3 — horizontal ST depression ≥ 0.5 mm, especially with positive terminal T and high notched R (R/R:S > 1, intrinsicoid deflection time of R ≥ 0.04 s); a high R alone without ST dynamics and clinical presentation is not a sufficient criterion for posterior MI
- When recording posterior leads — new ST elevation ≥ 0.5 mm in two or more contiguous leads V7–V9 (in men younger than 40 years, the threshold is higher — ≥ 1 mm)
- Pathological Q wave and decreased R in II, III, aVF with established necrosis
- Check V3R–V4R for ST elevation ≥ 0.5 mm (in men younger than 30 years, threshold ≥ 1 mm) — concomitant right ventricular infarction changes infusion therapy tactics
What it looks like on ECG
Inferoposterior myocardial infarction is the sum of two patterns. The inferior component is seen directly: ST-segment elevation in II, III, aVF, often with reciprocal depression in I and aVL. The posterior component is seen as a mirror image because standard precordial leads V1–V3 face the heart from the front, while the posterior wall is opposite to them. Therefore, ST elevation on the posterior wall is registered in V1–V3 as ST depression, and the pathological Q as an increase in the R wave.
| Leads | What to look for | Meaning |
|---|---|---|
| II, III, aVF | ST elevation | direct sign of inferior MI |
| I, aVL | ST depression | reciprocal sign |
| V1–V3 | ST depression, R/R:S > 1 | reciprocal sign of posterior MI |
| V7–V9 | ST elevation ≥ 0.5 mm in ≥ 2 contiguous leads (≥ 1 mm in men < 40 years) | direct sign of posterior MI |
| V3R–V4R | ST elevation ≥ 0.5 mm (≥ 1 mm in men < 30 years) | concomitant right ventricular MI |
If ST elevation in III is greater than in II, and there is ST depression in I, the probability of right coronary artery occlusion increases, and in combination with ST elevation in V4R, this supports proximal RCA occlusion with right ventricular infarction; final localization and the culprit artery are confirmed by coronary angiography. To confirm the posterior component, recording V7–V9 is recommended, where according to the universal definition of MI, the ST elevation threshold of ≥ 0.5 mm in two contiguous leads is used, and for men younger than 40 years — ≥ 1 mm (due to higher baseline ST amplitude in this group); electrodes are placed at the level of V6: V7 at the posterior axillary line, V8 at the scapular line, V9 at the paraspinal line.
Real ECGs: 8 examples
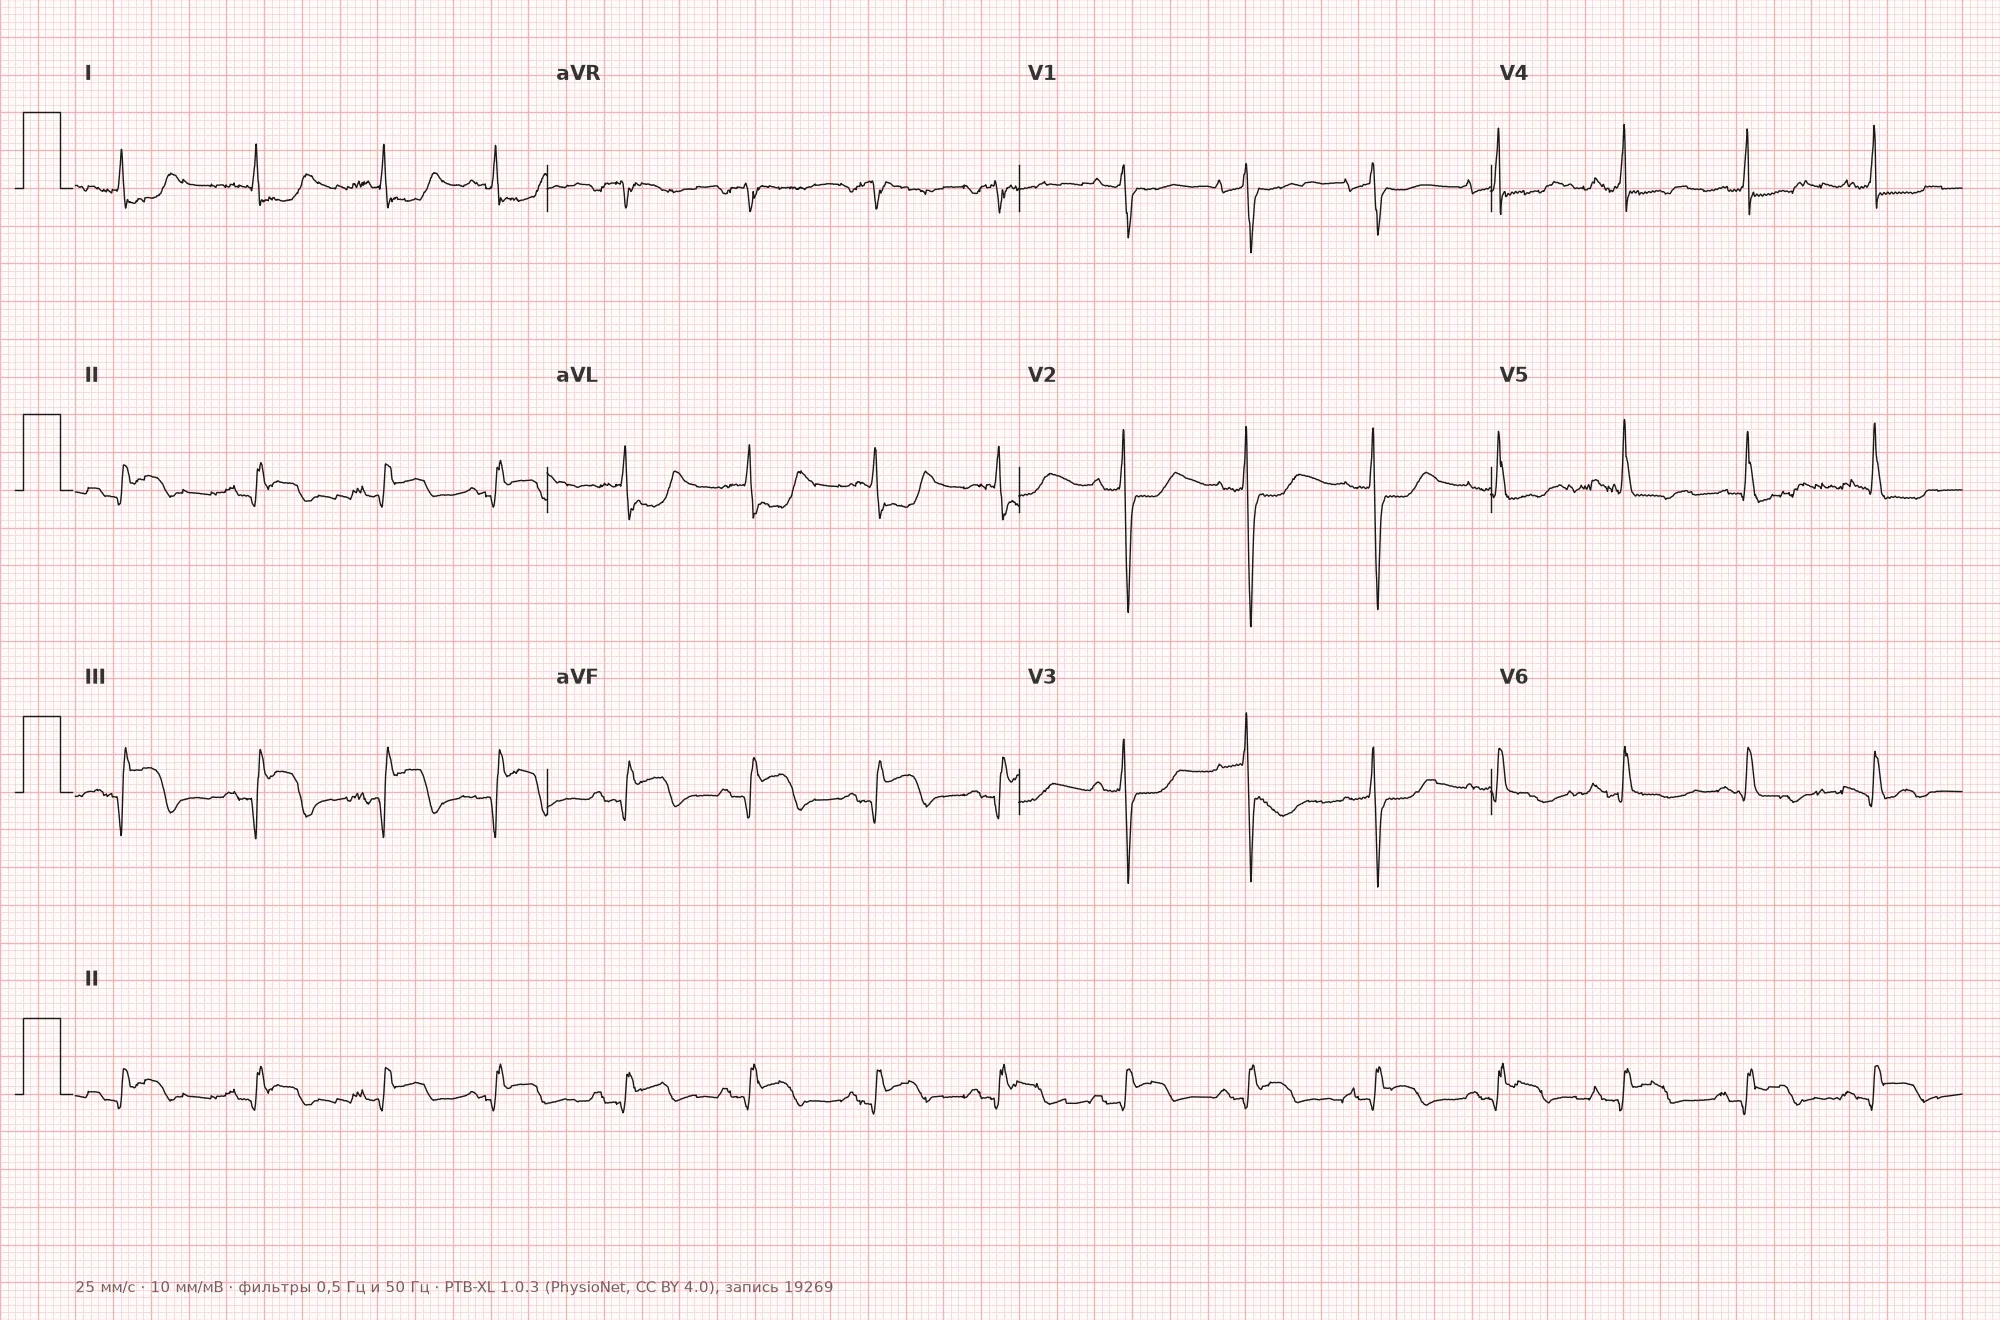
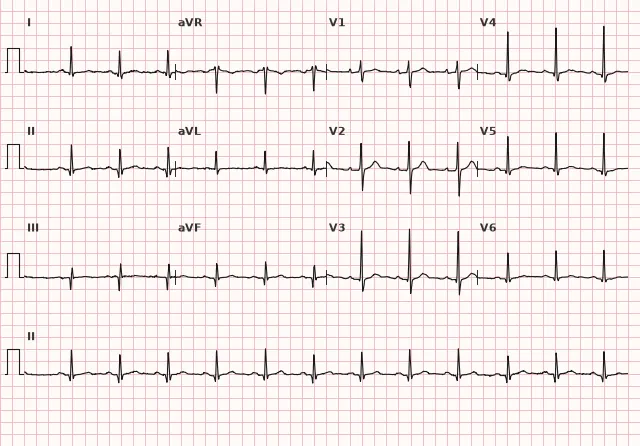
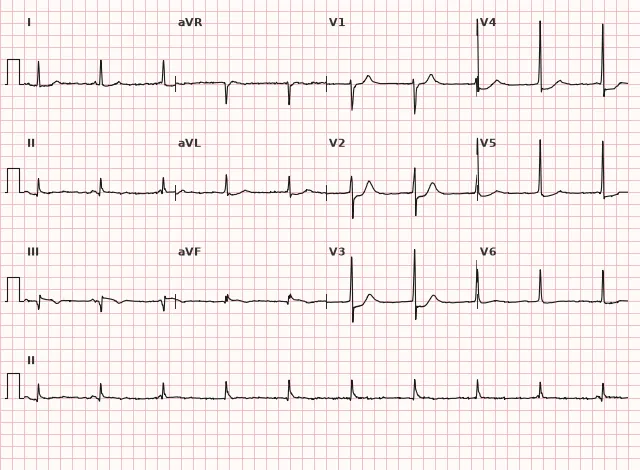
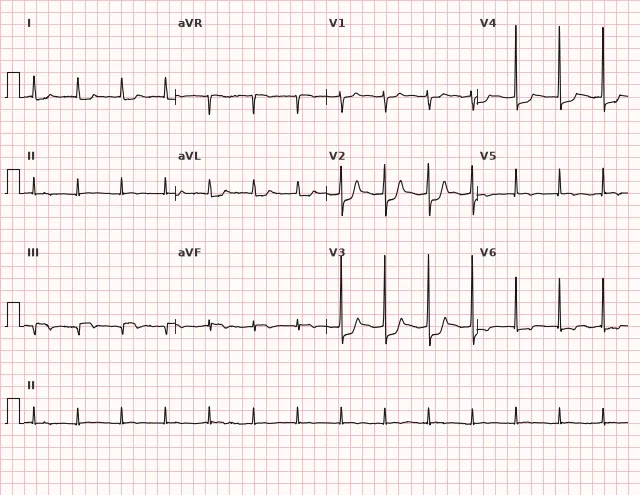
ECG from the open PTB-XL dataset (Wagner P. et al., Scientific Data, 2020; PhysioNet), CC BY 4.0 license. Rendering by WhiteCoat Pro.
Mechanism
Coronary blood supply to the inferior and posterior walls depends on dominance. With right dominance, the right coronary artery is more often the culprit of inferior MI and frequently causes concomitant right ventricular infarction, while the posterior component can be supplied by its own branch (posterior descending artery) or branches of the circumflex — depending on dominance. With occlusion proximal to the origin of the branches to the posterior wall, ischemia involves both the inferior and posterior zones simultaneously. Less commonly, the same pattern is produced by a dominant circumflex branch of the left coronary artery supplying the posterolateral wall. The posterior wall is not directly reflected in any of the 12 standard leads, so its ischemia and necrosis are registered as a mirror image in the anterior precordial leads — this is the reason for ST depression and high R in V1–V3 during actual posterior ST elevation.
Causes
- Occlusion of the right coronary artery (usually proximal or middle segment)
- Occlusion of the dominant circumflex branch of the left coronary artery
- Multivessel disease involving both basins
- Stent thrombosis in the specified arteries
Differential diagnosis
- Isolated inferior MI — usually no convincing posterior reciprocal or direct signs (ST depression and high R in V1–V3, ST elevation in V7–V9), but their absence does not completely exclude the posterior component
- Anteroseptal ischemia with ST depression in V1–V3 — distinguished by the absence of ST elevation in inferior leads and the pattern in V7–V9
- Inferolateral myocardial infarction — posterior and lateral involvement are frequently combined, and the severity of ST depression in V1–V3 alone does not reliably differentiate these variants; the lateral component is confirmed by ST elevation or signs of necrosis in I, aVL, V5–V6 (and not simply their presence, since reciprocal depression is possible in I and aVL in isolated inferior MI), taking into account clinical presentation, ECG dynamics, and, if necessary, coronary angiography
- Benign J-point elevation with high R in right precordial leads in young individuals — no ST elevation in inferior leads and no clinical presentation
- Right ventricular hypertrophy with high R in V1 — right axis deviation is present, no ST dynamics characteristic of ACS
Clinical significance and management
With persistent ischemic symptoms and typical dynamics, isolated ST depression in V1–V3 without overt ST elevation in inferior leads requires immediate evaluation as a potential posterior STEMI equivalent and urgent reperfusion strategy; when in doubt, V7–V9 should be recorded immediately and the ECG repeated. With overt ST elevation in II, III, aVF, the diagnosis of STEMI is obvious. The physician must record right precordial leads V3R–V4R to rule out right ventricular infarction: in its hemodynamically significant variant, caution is required with nitrates and diuretics, and careful preload restoration in hypotension without signs of congestion. The risk of bradyarrhythmias and AV blocks is increased due to AV nodal ischemia (supplied by the right coronary artery in the majority of people), therefore rhythm monitoring and readiness for temporary pacing are necessary. Emergency coronary angiography with primary PCI in the shortest possible time, as in any STEMI, is indicated.
Common interpretation errors
- Interpretation of ST depression in V1–V3 as 'anterior wall ischemia' without considering posterior MI
- Diagnosis of posterior MI based solely on a high R without ST dynamics and clinical context
- Failure to record V7–V9 with suspicious ST depression in right precordial leads
- Ignoring V3R–V4R in inferior MI and, consequently, missing right ventricular infarction
- Mechanical application of the same ST elevation threshold for V7–V9 and V3R–V4R without regard to age and sex: the baseline threshold is ≥ 0.5 mm in two contiguous leads, but in men younger than 40 years (for V7–V9) and younger than 30 years (for V3R–V4R), the threshold is higher — ≥ 1 mm
1. What pattern in V1–V3 is characteristic of the posterior component of an inferoposterior myocardial infarction?
The posterior wall is not directly visible in any standard lead, therefore its ST elevation and forming Q wave are reflected as a mirror image in V1–V3 as ST depression and high R.
2. At what minimum ST elevation threshold in two contiguous leads V7–V9 is posterior MI diagnosed in the majority of patients?
Posterior leads use a lower baseline ST elevation threshold — 0.5 mm in two or more contiguous leads; a threshold of 1 mm is applied separately for men younger than 40 years.
3. Which additional lead must be checked in inferoposterior myocardial infarction to rule out right ventricular MI?
V4R is a key lead for diagnosing right ventricular infarction (ST-segment elevation ≥ 0.5 mm, in men under 30 years old ≥ 1 mm), which changes management tactics, specifically infusion therapy.
Frequently asked questions
How to distinguish inferoposterior MI from isolated inferior MI?
In inferoposterior myocardial infarction, there is additionally ST-segment depression and a tall R wave in V1–V3, while posterior leads V7–V9 show direct ST-segment elevation ≥ 0.5 mm in two or more contiguous leads (in men under 40 years old — ≥ 1 mm). Isolated inferior MI typically does not produce such changes in the right precordial leads, although their absence does not rule out a mild posterior component.
Why record leads V7–V9?
They record the posterior wall directly, unlike V1–V3, where a posterior MI is only seen reciprocally. ST-segment elevation in two contiguous leads V7–V9 (≥ 0.5 mm, and in men under 40 years old ≥ 1 mm) increases diagnostic confidence for a posterior component, but a negative recording does not rule it out.
Is inferoposterior myocardial infarction dangerous?
Yes, it is frequently combined with right ventricular infarction and AV node ischemia, which increases the risk of bradyarrhythmias, AV blocks, and hypotension. It requires emergency reperfusion just like STEMI.
Why is ST elevation greater in lead III than in lead II?
The STIII > STII ratio, especially combined with ST depression in I/aVL and ST elevation in V4R, increases the likelihood that the right coronary artery is the culprit, but does not rule out circumflex occlusion. The culprit artery is definitively identified by coronary angiography.
Should a patient with ST depression in V1–V3 and no ST elevation in inferior leads be managed as a STEMI?
This pattern, especially with a positive terminal T wave and a tall R wave, is suspicious for a posterior STEMI equivalent (2023 ESC guidelines). In the presence of ongoing ischemic symptoms and corresponding dynamics, it is managed according to the emergency reperfusion algorithm without waiting for classic ST elevation, but the decision takes symptoms and hemodynamics into account, rather than ST depression in isolation.
ECG Course
Interpretation from basics to myocardial infarction — learn to read any ECG using a systematic algorithm.
- Video lessons and theory for every topic
- Simulator case studies under every lesson
- Unlimited ECG simulator practice
- Study guide: "All ECGs in 25 minutes"
ECG Strip Simulator
ECG, radiology, histology, pathomorphology, pharmacology — thousands of flashcards with detailed explanations.
- Real ECG strips, not textbook drawings
- Instant answers and explanations
- Streaks and progress tracking in your dashboard
Related terms
More in the section "Ischemia and Myocardial Infarction"
Sources
- AHA/ACCF/HRS Recommendations for the Standardization and Interpretation of the ECG, 2009
- ESC Guidelines for the management of acute coronary syndromes, 2023
- Goldberger A.L. Clinical Electrocardiography
- Orlov V.N. Guide to Electrocardiography
Educational material for medical students and physicians. Does not replace clinical guidelines and physical examination; the ECG must always be interpreted in conjunction with the clinical picture.