ECG criteria
- Determine the J-point (end of QRS) in each lead.
- In suspected ACS, measure ST displacement relative to the isoelectric line (TP segment is preferred over PR) at the J-point itself; on an exercise ECG test, it is measured 60–80 ms after the J-point, typically J+80 ms at lower heart rates and J+60 ms during tachycardia.
- New or presumed new horizontal/downsloping ST depression ≥0.5 mm in two contiguous leads at the J-point is a suspicious ischaemic sign in ACS, especially with corresponding symptoms; it is not diagnostic on its own.
- Upsloping ST depression is generally not considered a diagnostic sign of ACS without additional context; exercise tests typically evaluate horizontal/downsloping depression ≥1 mm at 60–80 ms after the J-point.
- Evaluate the T wave: a new or presumed new T-wave inversion of depth ≥1 mm in two contiguous leads with a predominantly positive/prominent R wave in the appropriate clinical context is considered significant; the morphology (symmetry, peakedness) is non-specific on its own.
- Check for ST elevation in aVR in the presence of widespread ST depression (in ≥6 leads)—a marker of severe subendocardial ischaemia and high risk; the pattern is non-specific for left main coronary artery/proximal LAD disease and requires evaluation of haemodynamics, symptoms, serial ECGs, and troponin.
- Correlate the changes with clinical presentation and dynamics: appearance during pain and resolution after relief increases the likelihood of an ischaemic origin.
- Exclude secondary ST-T changes (LVH, bundle branch block, drugs, tachycardia, electrolyte disturbances) based on morphology and context.
What it looks like on ECG
The main ECG sign of ischaemia is ST-segment depression relative to the isoelectric line (preferably the TP segment, as the PR segment may be displaced). The measurement technique depends on the objective: in suspected ACS, ST displacement is assessed at the J-point itself; during an exercise ECG test, it is conventionally measured 60–80 ms after the J-point (typically J+80 ms at lower heart rates and J+60 ms during tachycardia) to avoid capturing the early part of the T wave. Horizontal depression: the segment runs parallel to the isoelectric line below it. Downsloping depression: the segment descends from the J-point toward the T wave.
New horizontal or downsloping ST depression ≥0.5 mm (0.05 mV) in two contiguous leads with a compatible clinical presentation is a suspicious sign of ischaemia, but is not specific on its own: new or dynamic changes and a clinical context are required, as ST depression can be chronic or non-specific.
Upsloping ST depression occurs more frequently with tachycardia and exercise tests without true ischaemia and is generally not regarded as a diagnostic sign of ACS without additional data; exercise testing protocols more commonly use a separate criterion—horizontal/downsloping depression ≥1 mm at 60–80 ms after the J-point.
The T wave in ischaemia may be inverted, biphasic, or of reduced amplitude in the same leads where the ST segment is depressed; a new or presumed new T-wave inversion of depth ≥1 mm in two contiguous leads with a predominantly positive R wave in the appropriate clinical context is considered significant. T-wave morphology (symmetry, peakedness) is non-specific on its own: a peaked, tall T wave primarily prompts the exclusion of hyperkalaemia and may also represent the hyperacute phase of acute coronary occlusion rather than chronic ischaemia.
Widespread ST depression (typically in ≥6 leads), especially combined with ST elevation in aVR (≥1 mm), indicates severe subendocardial ischaemia and requires urgent evaluation; left main or proximal LAD disease, multivessel disease, or a supply-demand mismatch without significant stenosis are possible—the pattern itself has low specificity and does not solely dictate immediate angiography management.
| ST depression type | Suspicion of ischaemia |
|---|---|
| Horizontal ≥0.5 mm in ≥2 contiguous leads | high |
| Downsloping ≥0.5 mm in ≥2 contiguous leads | high |
| Upsloping | low-moderate |
With ST depression, changes often involve multiple zones (septal V1–V2, anterior V3–V4, lateral I, aVL, V5–V6, inferior II, III, aVF), but, unlike diagnostic ST elevation, the localisation of depression is significantly less reliable in identifying the culprit artery. Dynamics are crucial: comparison with previous ECGs and resolution of changes after pain relief increases the likelihood of an ischaemic origin.
Real ECGs: 8 examples
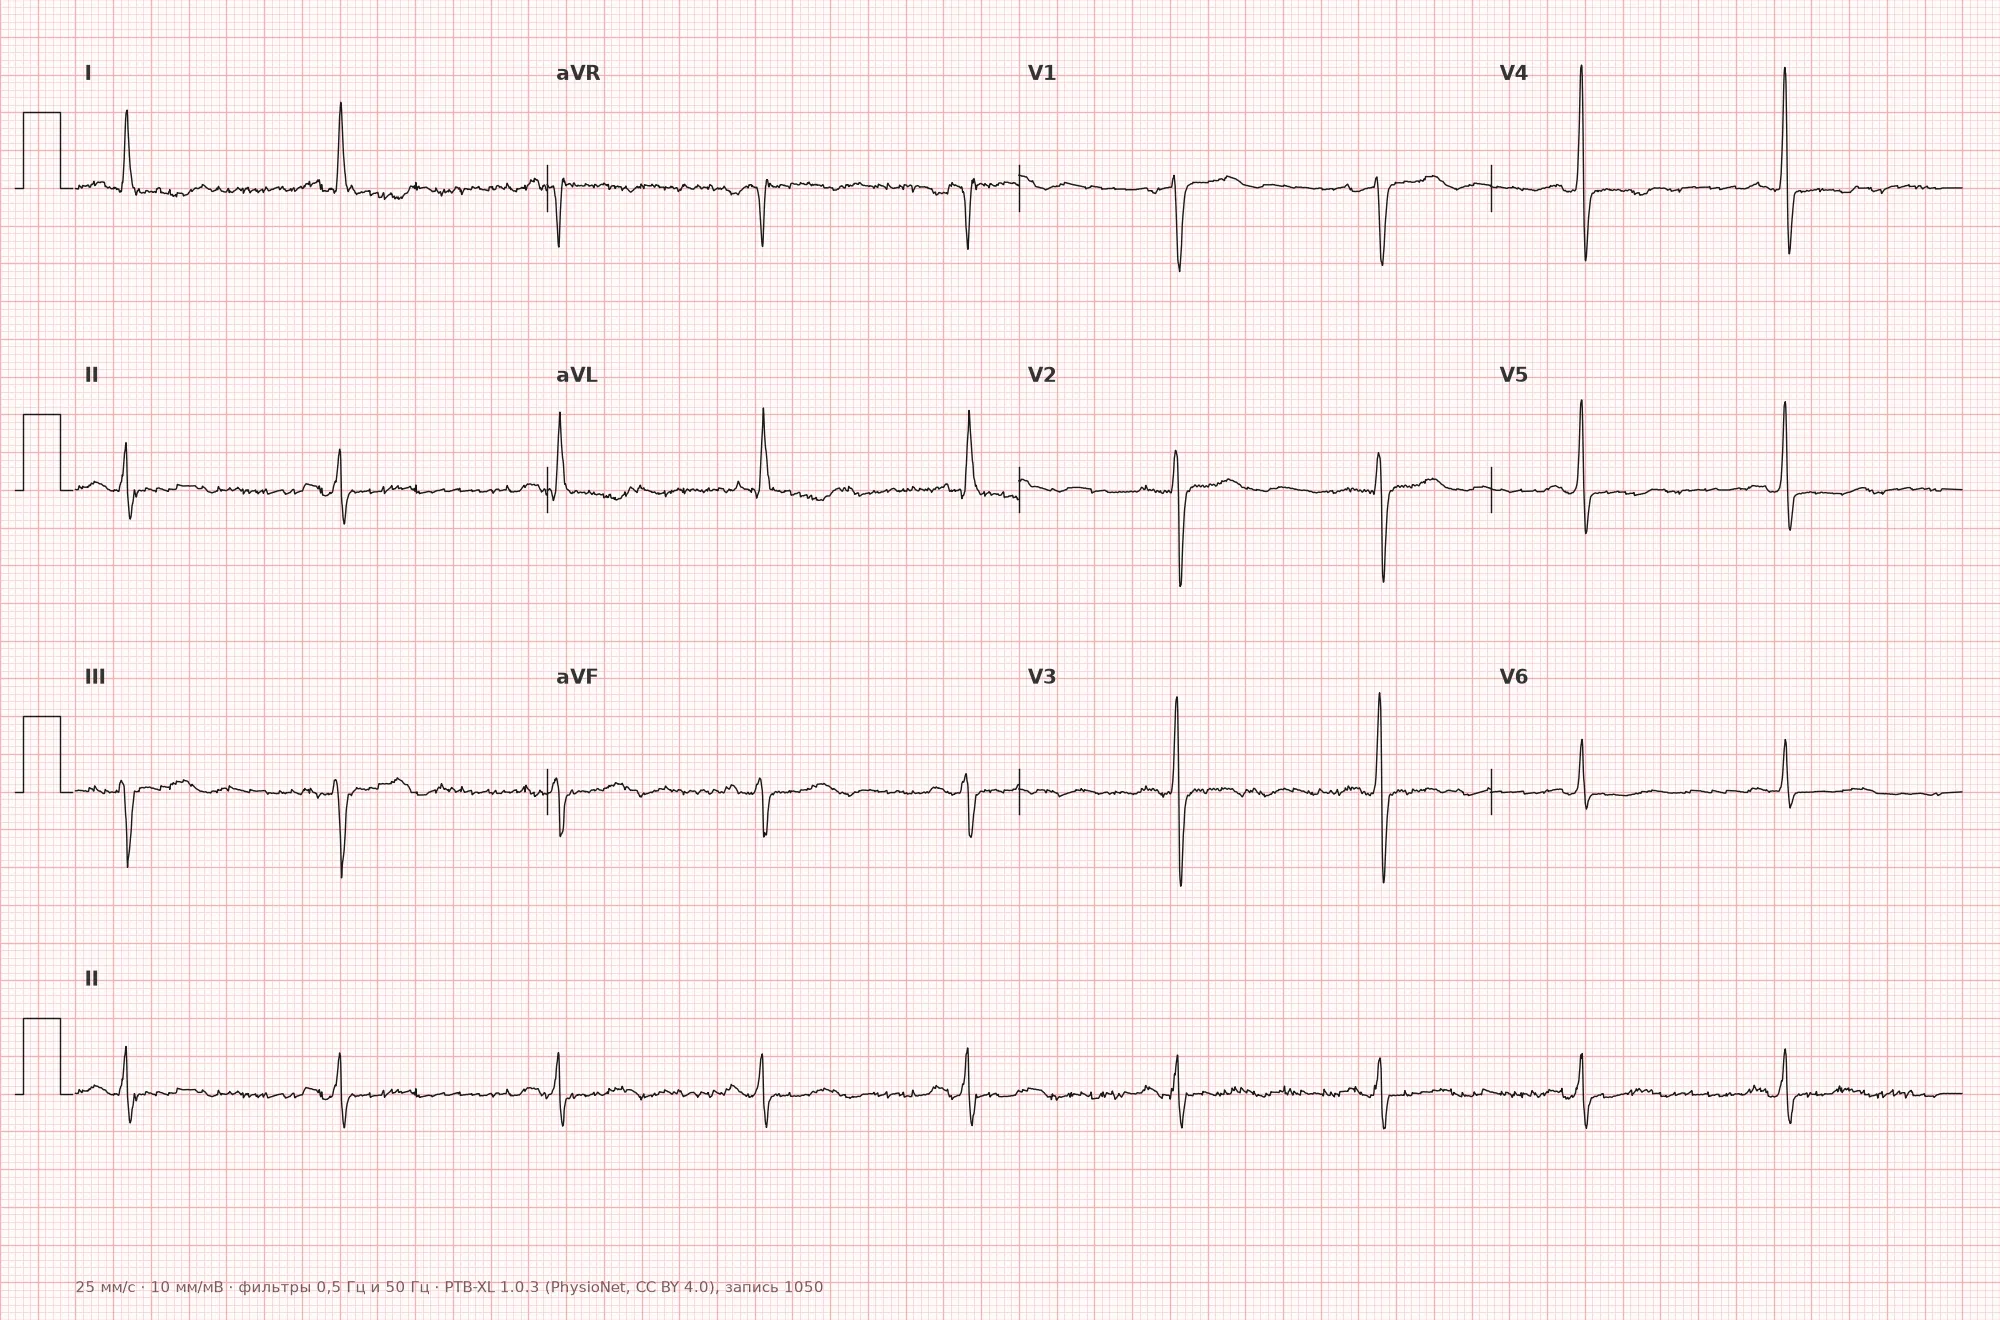
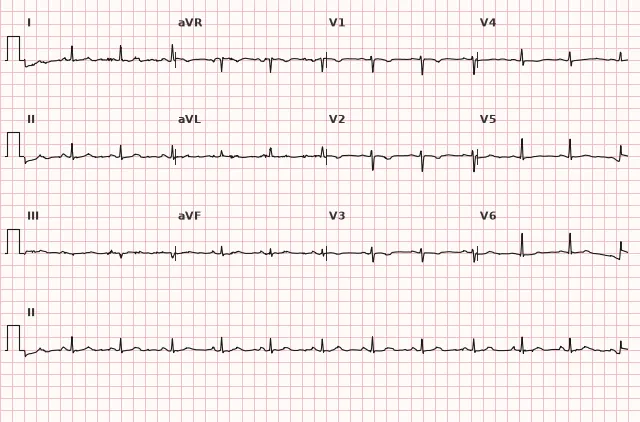
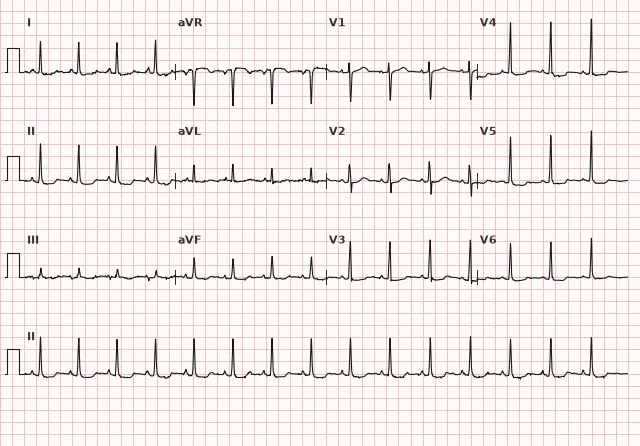
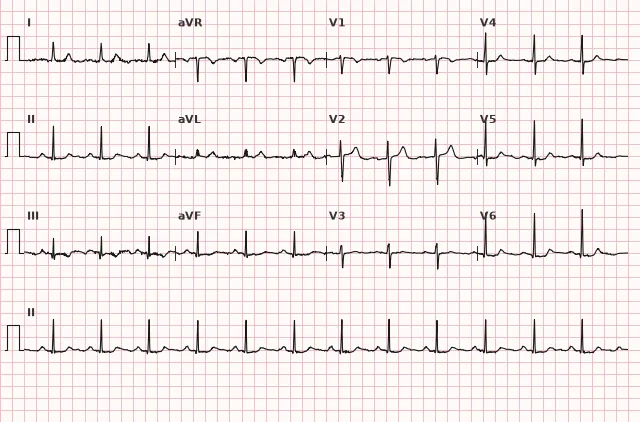
ECG from the open PTB-XL dataset (Wagner P. et al., Scientific Data, 2020; PhysioNet), CC BY 4.0 license. Rendering by WhiteCoat Pro.
Mechanism
When coronary blood flow decreases, the subendocardial layers of the myocardium are the first to suffer—they have a poorer blood supply and experience higher wall stress. Repolarisation is disrupted: the action potential in the ischaemic zone is altered, creating a potential difference between myocardial layers during the ST-T phase. Widespread subendocardial or global ischaemia (e.g. in multivessel disease, severe anaemia, tachyarrhythmia) often produces diffuse ST depression across most leads with reciprocal ST elevation in aVR, rather than a localised picture tied to a single vascular territory. Therefore, such a pattern cannot reliably determine localisation and the specific culprit artery—it reflects the extent and severity of ischaemia rather than precise coronary anatomy.
Causes
- Unstable angina and NSTEMI
- Stable exercise angina (during exercise stress testing)
- Vasospasm (Prinzmetal's angina) — usually ST elevation, but depression is also possible
- Multivessel atherosclerotic coronary artery disease
- Tachyarrhythmias with high heart rate (relative ischaemia due to shortened diastole)
- Hypertensive emergency, severe anaemia, hypoxaemia (oxygen supply-demand mismatch)
- Left ventricular hypertrophy with overload (secondary ST-T changes, require differentiation)
Differential diagnosis
- Secondary ST-T changes in LVH: downsloping ST depression with asymmetrical negative T waves in V5–V6, I, aVL, combined with voltage criteria for hypertrophy
- Left bundle branch block: discordant ST-T changes as an expected consequence of depolarization abnormality
- Digoxin effect: sagging ST depression ("scooped" ST); ST morphology and medication history aid recognition, but the presence of digoxin effect does not rule out concomitant ischaemia
- Hypokalaemia: ST depression with a flattened T wave and prominent U wave
- Normal juvenile T-wave variant (juvenile pattern): negative T wave in V1–V3 without ST depression and without symptoms
- Wellens' syndrome: reperfusion pattern, usually in critical proximal LAD stenosis; does not rule out ongoing ischaemia, acts as a high-risk marker — characterized by negative or biphasic T waves in V2–V3, exercise testing is not performed, urgent evaluation within an early invasive strategy for NSTE-ACS is required
Clinical significance and management
ST depression during a pain episode is an alarming sign that increases the probability of ischaemia and ACS; it requires urgent evaluation, but does not establish the diagnosis of NSTE-ACS on its own. The clinician must: record serial ECGs (repeat recordings after 15–30 min or when symptoms change), compare with the baseline ECG, determine serial hs-troponins, and stratify risk using scoring systems (GRACE). The final classification depends on clinical presentation, troponin dynamics, and risk: if troponin is elevated, it may indicate NSTEMI; if not elevated, unstable angina or another condition. Widespread ST depression combined with ST elevation in aVR indicates severe subendocardial ischaemia and high risk, but does not prove left main disease or determine indications for immediate angiography; decisions are made considering haemodynamics, clinical presentation, ECG dynamics, and troponin — such patients generally have an indication for an early invasive strategy if at high risk, whereas immediate coronary angiography is reserved for very high-risk features according to clinical guidelines. Isolated ST depression without symptoms and without dynamics is usually non-specific and requires cautious interpretation alongside the medical history.
Common interpretation errors
- Measuring ST displacement 60–80 ms after the J point where the ACS criteria require evaluation at the J point itself (and vice versa—using the J point instead of J+60–80 ms on an exercise test)
- Dismissing upsloping depression as "unimportant" in the presence of clear clinical symptoms—slope, magnitude, and duration must be assessed
- Ignoring ST elevation in aVR during widespread ST depression—missing a marker of severe ischemia, or conversely, overestimating it as a direct sign of left main coronary artery disease
- Interpreting ST-T changes during tachycardia as ischemia without evaluating the clinical context
- Failing to compare with previous ECGs, leading to chronic ST depression being mistaken for acute
1. On an exercise ECG test, ST-segment displacement is typically measured at what interval after the J point?
During an exercise test, it is standard practice to measure ST displacement 60–80 ms after the J point (adjusting for heart rate) to evaluate the ST segment rather than the early part of the T wave; when evaluating resting ACS, displacement is measured at the J point itself.
2. Which type of ST depression is considered most suspicious for myocardial ischemia?
Horizontal and downsloping ST depression ≥0.5 mm in two contiguous leads is the most suspicious sign of ischemia, although not entirely specific, according to AHA/ACCF/HRS and ESC criteria.
3. What might the combination of widespread ST depression and ST elevation in lead aVR indicate?
This pattern indicates pronounced subendocardial ischemia and increased risk, but is by itself insufficiently specific: left main/proximal LAD disease, multivessel disease, or an imbalance in myocardial oxygen supply and demand without significant stenosis are all possible.
Frequently asked questions
What ST depression is considered significant?
New horizontal or downsloping ST depression ≥0.5 mm (0.05 mV) in two contiguous leads. When ACS is suspected, displacement is measured at the J point; on an exercise test, it is measured 60–80 ms after the J point, adjusted for heart rate. Upsloping depression is less specific and is generally not considered a diagnostic sign of ACS without additional context.
Is ST depression on an ECG dangerous?
ST depression by itself is merely a suspicious ECG finding that requires correlation with clinical presentation. In the presence of pain and symptoms of ACS, it indicates an unstable condition and risk of progression, but the diagnosis is established based on the combination of clinical picture, ECG dynamics, and troponin levels. Widespread depression with ST elevation in aVR is particularly concerning and requires urgent evaluation.
How to differentiate ischemia from secondary ST-T changes in hypertrophy?
In LVH, ST depression and T-wave inversion are usually accompanied by voltage criteria for hypertrophy and an asymmetric T-wave morphology. This pattern is stable over time, which supports its secondary origin, but does not rule out concomitant acute ischemia—serial dynamics, clinical context, and additional data (troponin, repeat ECGs) remain decisive.
Can ST depression determine which coronary artery is affected?
The localization of ST depression is significantly less reliable for identifying the culprit artery than ST elevation in STEMI. Widespread depression with reciprocal elevation in aVR points more toward pronounced high-risk subendocardial ischemia (left main/proximal LAD disease or multivessel disease are possible) than toward a specific coronary artery—the specificity of this pattern for precise coronary anatomy is low.
How does ischemia differ from myocardial injury on an ECG?
Ischemia may manifest as ST depression or elevation and T-wave changes. ST elevation in the appropriate clinical context requires ruling out acute coronary occlusion, but does not prove necrosis by itself. The diagnosis of myocardial infarction is established considering clinical presentation and troponin dynamics, rather than an isolated ECG picture.
ECG Course
Interpretation from basics to myocardial infarction — learn to read any ECG using a systematic algorithm.
- Video lessons and theory for every topic
- Simulator case studies under every lesson
- Unlimited ECG simulator practice
- Study guide: "All ECGs in 25 minutes"
ECG Strip Simulator
ECG, radiology, histology, pathomorphology, pharmacology — thousands of flashcards with detailed explanations.
- Real ECG strips, not textbook drawings
- Instant answers and explanations
- Streaks and progress tracking in your dashboard
Related terms
More in the section "Ischemia and Myocardial Infarction"
Sources
- AHA/ACCF/HRS Recommendations for the Standardization and Interpretation of the ECG, 2009
- Goldberger's Clinical Electrocardiography, latest edition
- ESC Guidelines for the management of acute coronary syndromes
- Orlov V.N. Guide to Electrocardiography
Educational material for medical students and physicians. Does not replace clinical guidelines and physical examination; the ECG must always be interpreted in conjunction with the clinical picture.