ECG criteria
- Right axis deviation: angle > +90°, more often > +110° (after excluding other causes)
- R in V1 >6–7 mm and/or R/S in V1 > 1 with normal QRS duration is one of the possible criteria in adults, assessed alongside others; the sum of R in V1 + S in V5 or V6 > 10.5 mm is also used. Overall, RVH criteria have low sensitivity and depend on age, sex, heart position, and body habitus
- R/S < 1 in V5 or V6 (diminished R wave, increasing S towards lateral leads); additionally, S in V5 or V6 >7 mm may be used
- qR pattern in V1 without myocardial infarction is a highly specific, but insensitive sign
- T-wave inversion or depression in V1–V3 (RV "strain") is a possible secondary sign of RV overload/hypertrophy, but it is nonspecific; it does not rule out ischemia and occurs in pulmonary embolism, acute RV overload state, anterior ACS, RBBB
- Tall peaked P wave >2.5 mm in II/III/aVF (P pulmonale); the initial positive phase of P may be increased in V1 — an indirect and nonspecific sign of right atrial enlargement, not an RVH criterion
- Incomplete or complete right bundle branch block as a frequent concomitant conduction disturbance
What it looks like on ECG
The main pattern is the alteration of the R and S ratio across the chest leads. Normally, the R wave progresses from V1 to V5–V6, while S decreases. In RVH, this progression is disrupted or inverted: in V1, R becomes dominant (R/S > 1, R usually >6–7 mm), while a prominent S persists in V5 or V6 (R/S < 1).
| Lead | Typical finding in RVH |
|---|---|
| V1 | R/S > 1, R >6–7 mm, qR possible |
| V5 or V6 | R/S < 1, S >7 mm |
| II, III, aVF | signs of P pulmonale may be present with concomitant right atrial enlargement |
| aVR | R may increase in marked RV overload |
The electrical axis deviates to the right, often beyond +110°, sometimes reaching the indeterminate ("northwest") zone in severe overload. T-wave inversion or depression is frequently visible in V1–V3 (RV "strain") — this may reflect secondary repolarization changes during RV overload, but the sign is nonspecific. With new or dynamic T-wave inversion, acute coronary syndrome, pulmonary embolism, and other acute causes must be ruled out based on clinical presentation, serial ECGs, troponin, and imaging as indicated. Incomplete right bundle branch block (rSR' in V1) is frequently concomitant — it must be distinguished from true RVH by R wave voltage and QRS width.
Signs of acute right ventricular overload should be evaluated separately from chronic RVH: the S1Q3T3 pattern (S in I, Q and inverted T in III) and the S1S2S3 pattern (S in I, II, and III) — both are low-sensitivity, are not RVH criteria, and are classically discussed when acute RV overload (primarily pulmonary embolism) is suspected, rather than as confirmation of chronic hypertrophy.
The sensitivity of ECG criteria for RVH is low (significant hypertrophy may not produce overt changes), and specificity is higher when multiple signs are combined (tall R in V1 + axis deviation + P pulmonale).
Real ECGs: 8 examples
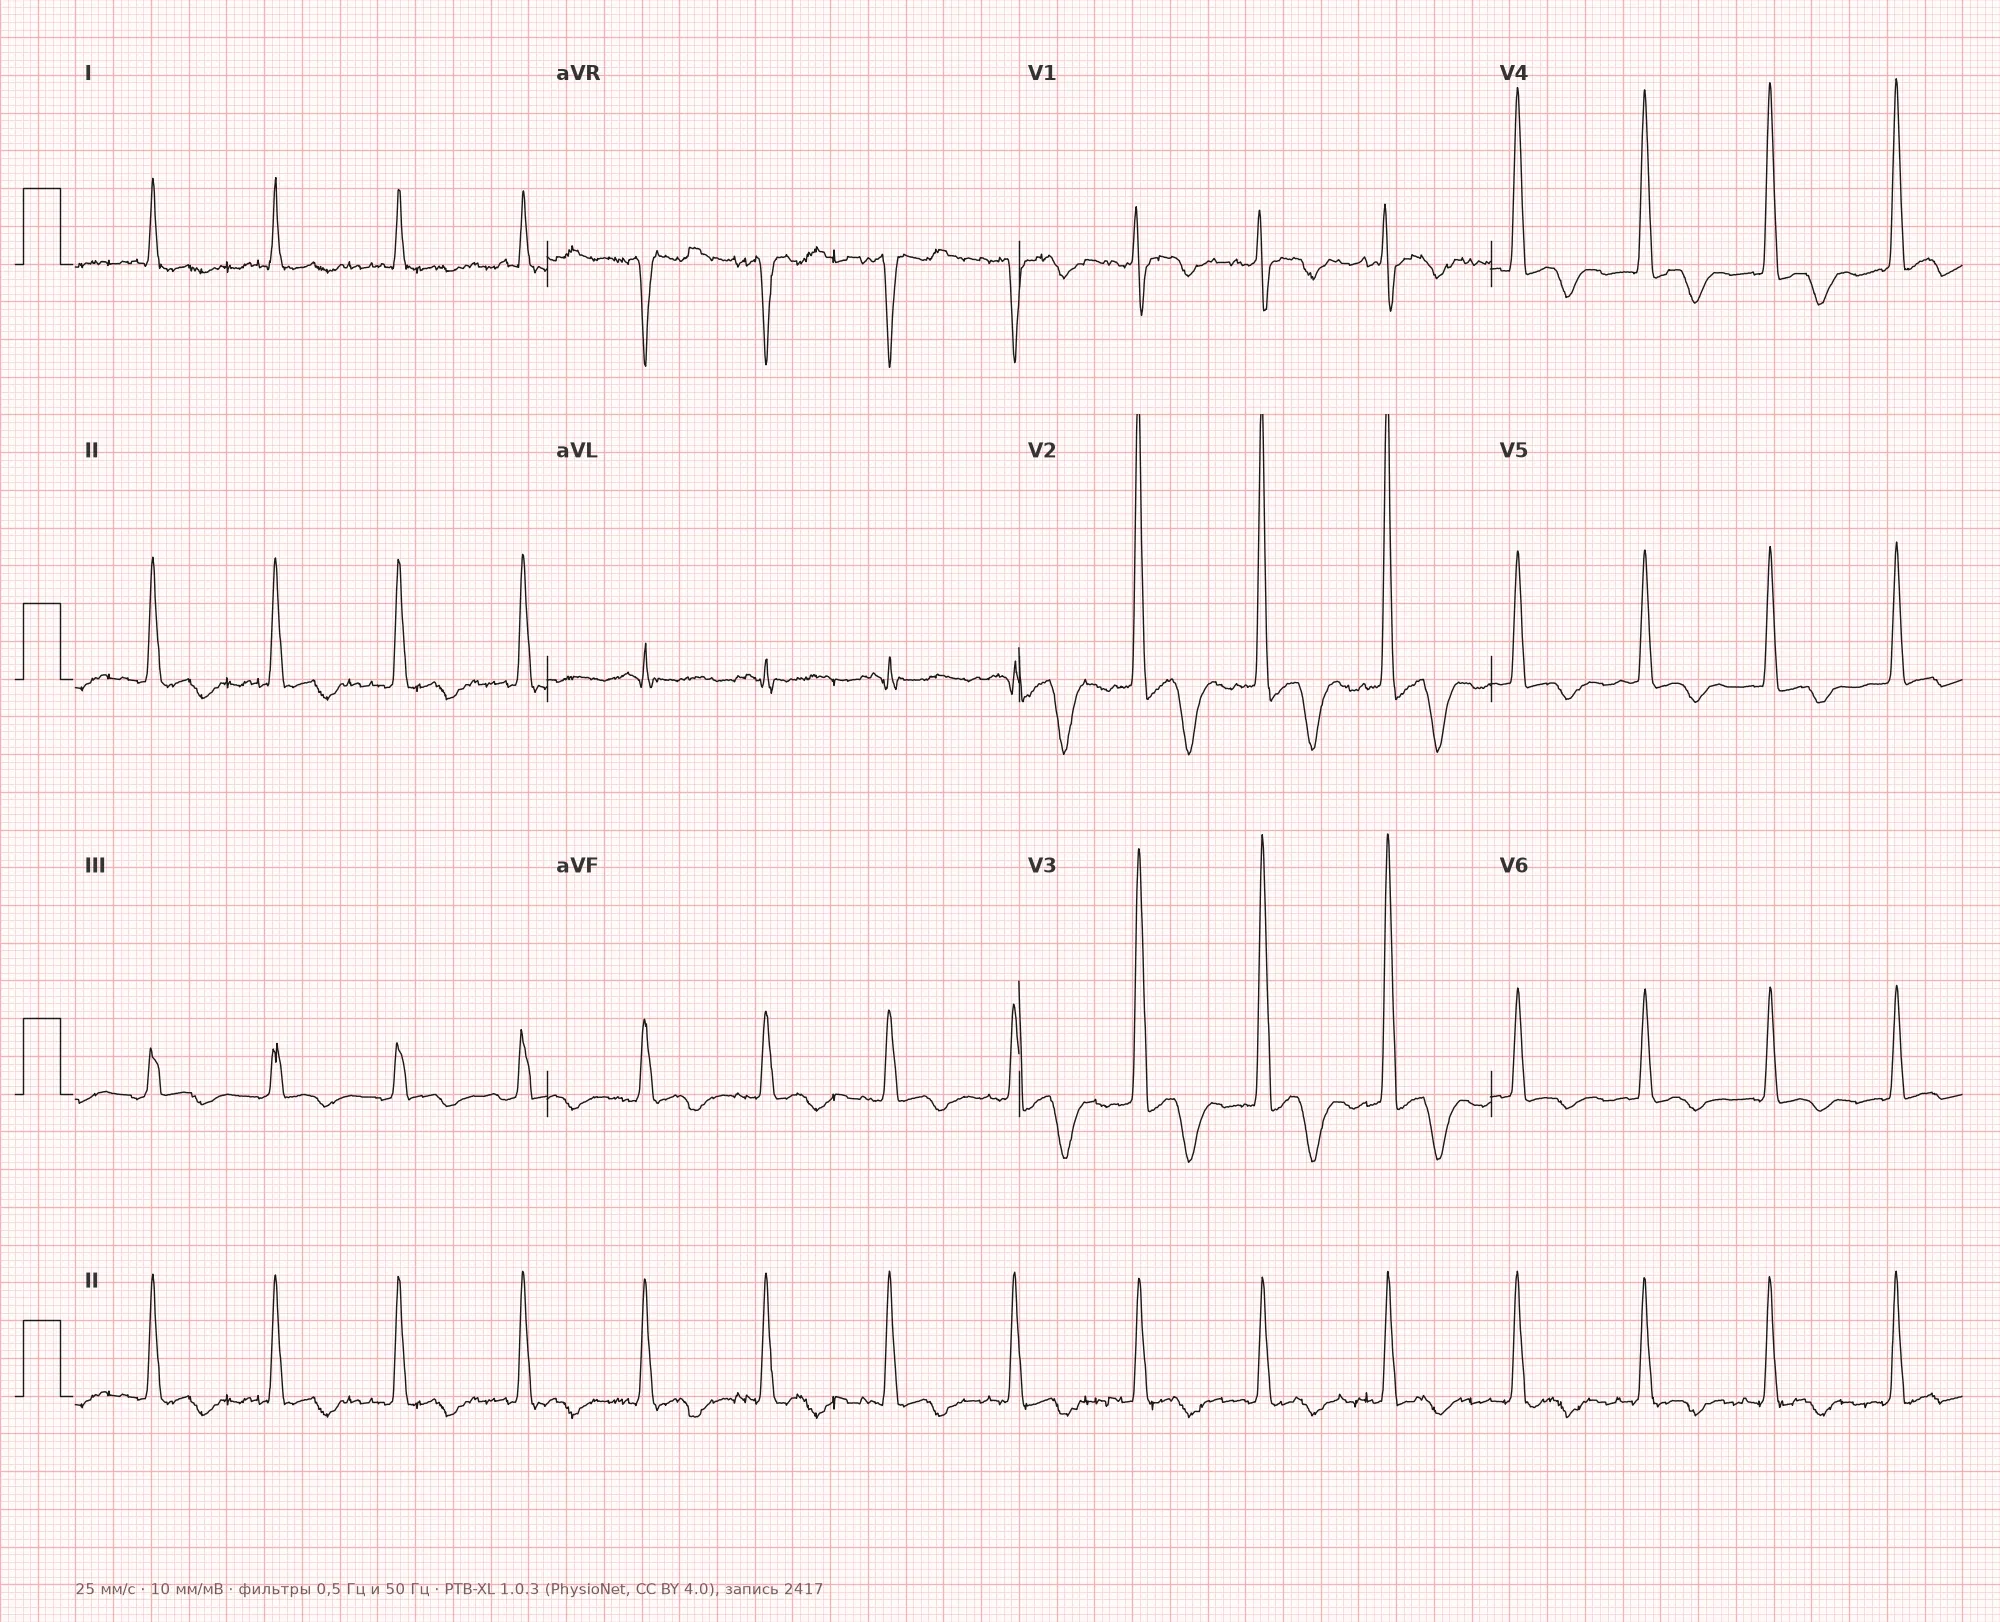
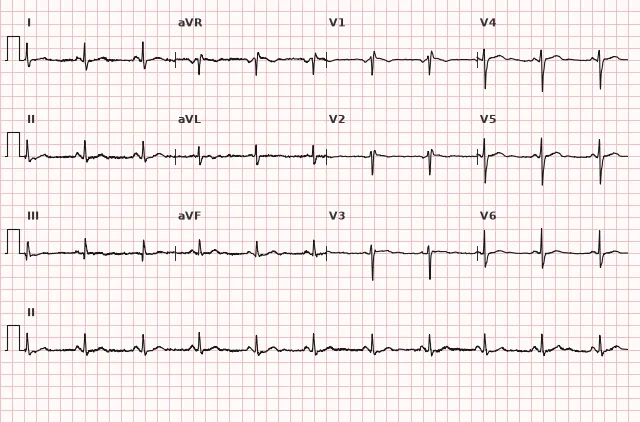
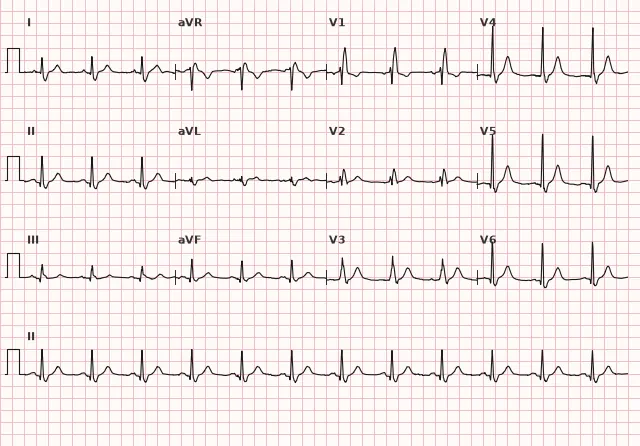
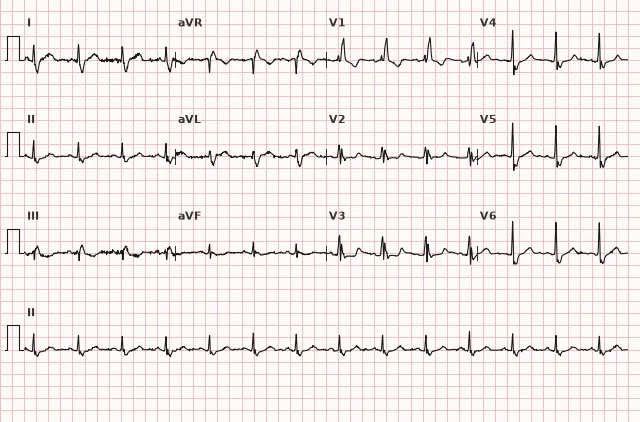
ECG from the open PTB-XL dataset (Wagner P. et al., Scientific Data, 2020; PhysioNet), CC BY 4.0 license. Rendering by WhiteCoat Pro.
Mechanism
Normally, the mass of the left ventricle is 2–3 times greater than that of the right, so the electrical vector of ventricular depolarization is directed to the left and posteriorly, producing a small R in V1 and a dominant R in V5–V6. In right ventricular hypertrophy, its mass and, consequently, its electrical contribution increase. The net QRS vector shifts to the right and anteriorly — resulting in an increased R in V1 and right axis deviation.
Secondary repolarization changes can occur during overload/RVH — typically negative T waves and/or ST-T changes in V1–V3 (sometimes deeper), related to the altered sequence of depolarization and secondary repolarization of the hypertrophied wall. These changes are nonspecific and not mandatory — marked RVH is not always accompanied by a characteristic strain pattern. Concomitant right atrial enlargement (P pulmonale) frequently goes hand in hand with RVH, as both chambers suffer from the same overload (pressure or volume).
Causes
- Chronic obstructive pulmonary disease and chronic cor pulmonale
- Primary and secondary pulmonary hypertension
- Pulmonary stenosis
- Tetralogy of Fallot and other congenital heart defects with RV overload
- Atrial septal defect: causes predominantly volume overload and RV dilation; true RVH is possible with a significant shunt and/or developed pulmonary hypertension
- Transposition of the great arteries: not a universal cause of RVH — significance depends on the specific type of anomaly, surgical correction, and which ventricle performs systemic work
- Mitral stenosis with secondary pulmonary hypertension
- Chronic pulmonary embolism (chronic thromboembolic pulmonary hypertension)
- Obstructive sleep apnea syndrome with severe hypoxemia
- Idiopathic pulmonary arterial hypertension
Differential diagnosis
- Posterior myocardial infarction: can mimic a tall R in V1–V3. Corresponding ST-T changes, dynamics, clinical presentation, and ST elevation in V7–V9 support posterior STEMI; the electrical axis can be in any position, and the absence of right axis deviation does not rule out the diagnosis.
- Right bundle branch block: R' in V1 occurs in the setting of a widened QRS (≥ 120 ms in complete block) with typical rSR' morphology; in RVH, QRS is usually not widened.
- WPW syndrome with a right-sided accessory pathway: produces pseudoinfarct and pseudohypertrophic patterns due to the delta wave; look for shortened PR interval and delta wave.
- Dextrocardia and improper chest lead placement: can mimic poor R-wave progression and axis shift; check lead placement and limb lead P wave amplitude.
- Normal variant in children and slender young adults: a dominant R in V1 may be a juvenile variant without clinical signs of right heart overload.
- Acute right ventricular overload (e.g., in pulmonary embolism): S1Q3T3 and S1S2S3 patterns are nonspecific and do not in themselves indicate chronic RVH or pulmonary embolism — they are evaluated alongside clinical findings, D-dimer, and imaging.
Clinical significance and management
An ECG picture of RVH is an indication to look for the cause of right ventricular overload: pulmonary pathology, valvular heart disease, pulmonary hypertension. The ECG alone does not establish the diagnosis — criteria sensitivity is limited, so a negative ECG does not rule out hypertrophy.
The physician should: correlate the finding with clinical presentation (dyspnea, cyanosis, signs of right ventricular failure), refer the patient for echocardiography as the primary method to assess RV size and function, tricuspid regurgitation, and the probability of pulmonary hypertension; in cases of uncertainty or when precise morphometry is needed, cardiac MRI is used, and right heart catheterization is performed per indications to confirm pulmonary hypertension. Pulmonary and cardiac history should be reviewed. When T-wave inversion in V1–V3 occurs in the setting of RV overload, it is important to remember that this is a probable secondary sign, not proof of its cause and not an exclusion of ischemia: the absence of acute symptoms or dynamics does not rule out ACS, especially in diabetic patients, the elderly, and in paucisymptomatic presentations, and secondary changes in RVH and ischemic changes may coexist. Clinical findings, serial ECGs, and troponin are evaluated.
Common interpretation errors
- Diagnosing RVH based on a single sign alone (e.g., R in V1 only) without assessing the axis and concomitant findings
- Interpreting S1Q3T3 or S1S2S3 as confirmation of RVH rather than as a low-specificity pattern requiring separate clinical evaluation
- Missing an incomplete right bundle branch block as an alternative explanation for the morphology in V1
- Mistaking a posterior infarction for RVH due to a similar picture in V1–V2
- Failing to account for age-related normal variants in children and adolescents
1. Which sign in V1 is most characteristic of right ventricular hypertrophy?
R/S >1 in V1, especially with R >6 mm, is one of the criteria for RVH; a wide rSR' is typical for right bundle branch block. A diagnosis is not made on the basis of a single sign — assessment of the axis and other findings is required.
2. Which combination of ECG findings additionally increases the specificity of right ventricular hypertrophy (RVH) diagnosis, aside from a tall R wave in V1?
Right axis deviation and P pulmonale reflect general right heart overload and increase the specificity of the RVH diagnosis.
3. Which condition most frequently requires differentiation from RVH based on the V1–V2 pattern?
Posterior myocardial infarction can produce a tall R wave in V1–V2; it is distinguished by ST-T changes, dynamics, clinical presentation, and ST-segment elevation in V7–V9, while the absence of right axis deviation does not rule out the diagnosis.
Frequently asked questions
How to distinguish right ventricular hypertrophy from right bundle branch block?
In bundle branch block, the QRS complex is widened (≥ 120 ms in complete block) with a typical rSR' morphology in V1 and a wide S wave in I, V5–V6. In RVH, the QRS duration is usually normal, and the main features are a tall R wave in V1 and right axis deviation.
Is right ventricular hypertrophy dangerous?
The ECG finding itself is not directly life-threatening, but it indicates chronic right heart overload—most commonly pulmonary hypertension or chronic pulmonary disease. The prognosis depends on the underlying disease and the degree of overload, so the finding requires further evaluation.
Can a diagnosis of RVH be made based on the ECG alone?
No. ECG criteria have low sensitivity, especially in the early stages of hypertrophy. Echocardiography is the primary method for assessing RV size and function, tricuspid regurgitation, and the probability of pulmonary hypertension; cardiac MRI is used in cases of uncertainty or when precise morphometry is needed, and right-heart catheterization is performed per indications to confirm pulmonary hypertension.
Why is the T wave negative in the right precordial leads in RVH?
This is a likely secondary sign of right ventricular "overload" associated with altered repolarization of the hypertrophied wall, but it is nonspecific. By itself, it does not prove the cause of the overload nor does it rule out ischemia: the absence of acute clinical symptoms or dynamic changes does not guarantee that the changes are non-ischemic, especially in elderly patients and those with diabetes mellitus. In case of a new or questionable pattern, clinical presentation, serial ECGs, and troponin levels are evaluated.
Do all patients with pulmonary hypertension have signs of RVH on their ECG?
No, in moderate pulmonary hypertension, the ECG may remain normal. The absence of changes does not rule out significant right ventricular overload, which is why echocardiography plays a decisive role, supplemented by cardiac MRI and catheterization when necessary.
ECG Course
Interpretation from basics to myocardial infarction — learn to read any ECG using a systematic algorithm.
- Video lessons and theory for every topic
- Simulator case studies under every lesson
- Unlimited ECG simulator practice
- Study guide: "All ECGs in 25 minutes"
ECG Strip Simulator
ECG, radiology, histology, pathomorphology, pharmacology — thousands of flashcards with detailed explanations.
- Real ECG strips, not textbook drawings
- Instant answers and explanations
- Streaks and progress tracking in your dashboard
Related terms
More in the section «Hypertrophy and Chamber Enlargement»
Sources
- Surawicz B., Knilans T. Chou's Electrocardiography in Clinical Practice
- Goldberger A. Clinical Electrocardiography: A Simplified Approach
- Orlov V.N. Guide to Electrocardiography
- AHA/ACCF/HRS Recommendations for the Standardization of the Electrocardiogram, 2009
Educational material for medical students and physicians. Does not replace clinical guidelines and physical examination; the ECG must always be interpreted in conjunction with the clinical picture.