ECG criteria
- Sokolow–Lyon index: S in V1 + R in V5 or V6 (whichever is larger) ≥ 35 mm in adults; the result depends on age, gender, body build, and heart position, being frequently false-positive in young and slender individuals; separate age-specific normal values are used in children
- Cornell voltage criterion: R in aVL + S in V3 > 28 mm in men, > 20 mm in women
- Cornell product: (R aVL + S V3, mm) × QRS duration (ms) > 2440 mm·ms
- R in aVL > 11 mm (isolated criterion without considering S in V3)
- R in I + S in III > 25 mm
- Left axis deviation may accompany LVH, but it is not a mandatory criterion and is nonspecific
- Prolonged intrinsicoid deflection time in V5–V6 > 50 ms
- Romhilt–Estes criteria: ≥ 5 points — definite LVH, 4 points — probable LVH — a point-scoring system taking into account voltage, ST-T, P-mitrale, axis, and intrinsicoid deflection time
What it looks like on ECG
The basis of diagnosis is voltage criteria. Amplitude increases in the chest leads: deep S in V1–V2 and high R in V5–V6. The Sokolow–Lyon index (S V1 + R V5/V6 ≥ 35 mm) and the Cornell criterion (R aVL + S V3 adjusted for gender) are most commonly used.
In the limb leads, R increases in I and aVL, and the electrical axis of the heart often deviates to the left, although this is an optional sign. QRS is usually of normal width (less than 120 ms), but with pronounced hypertrophy, moderate prolongation is possible due to increased conduction time through the thick LV wall.
In hypertrophy with systolic overload (strain pattern), leads with a high R (I, aVL, V5–V6) show a downsloping ST depression with an asymmetrical negative T wave — mirror images in leads with a deep S (V1–V2) may show a mild ST elevation.
Left atrial enlargement is frequently present (P mitrale: broad notched P in II > 120 ms, biphasic P in V1 with a deep negative phase).
| Criterion | Cut-off |
|---|---|
| Sokolow-Lyon | S(V1)+R(V5/V6) ≥ 35 mm |
| Cornell (male) | R(aVL)+S(V3) > 28 mm |
| Cornell (female) | R(aVL)+S(V3) > 20 mm |
| R in aVL | > 11 mm |
The sensitivity of most individual ECG criteria for LVH is low and variable, often around 20–50% (lower in obesity and the elderly); specificity is usually higher, but also depends on the chosen criterion and the composition of the population. The ECG has low and variable sensitivity, but relatively high specificity: the presence of criteria supports LVH, but their absence does not exclude it; echocardiography is required to assess LV mass and geometry.
Real ECGs: 8 examples
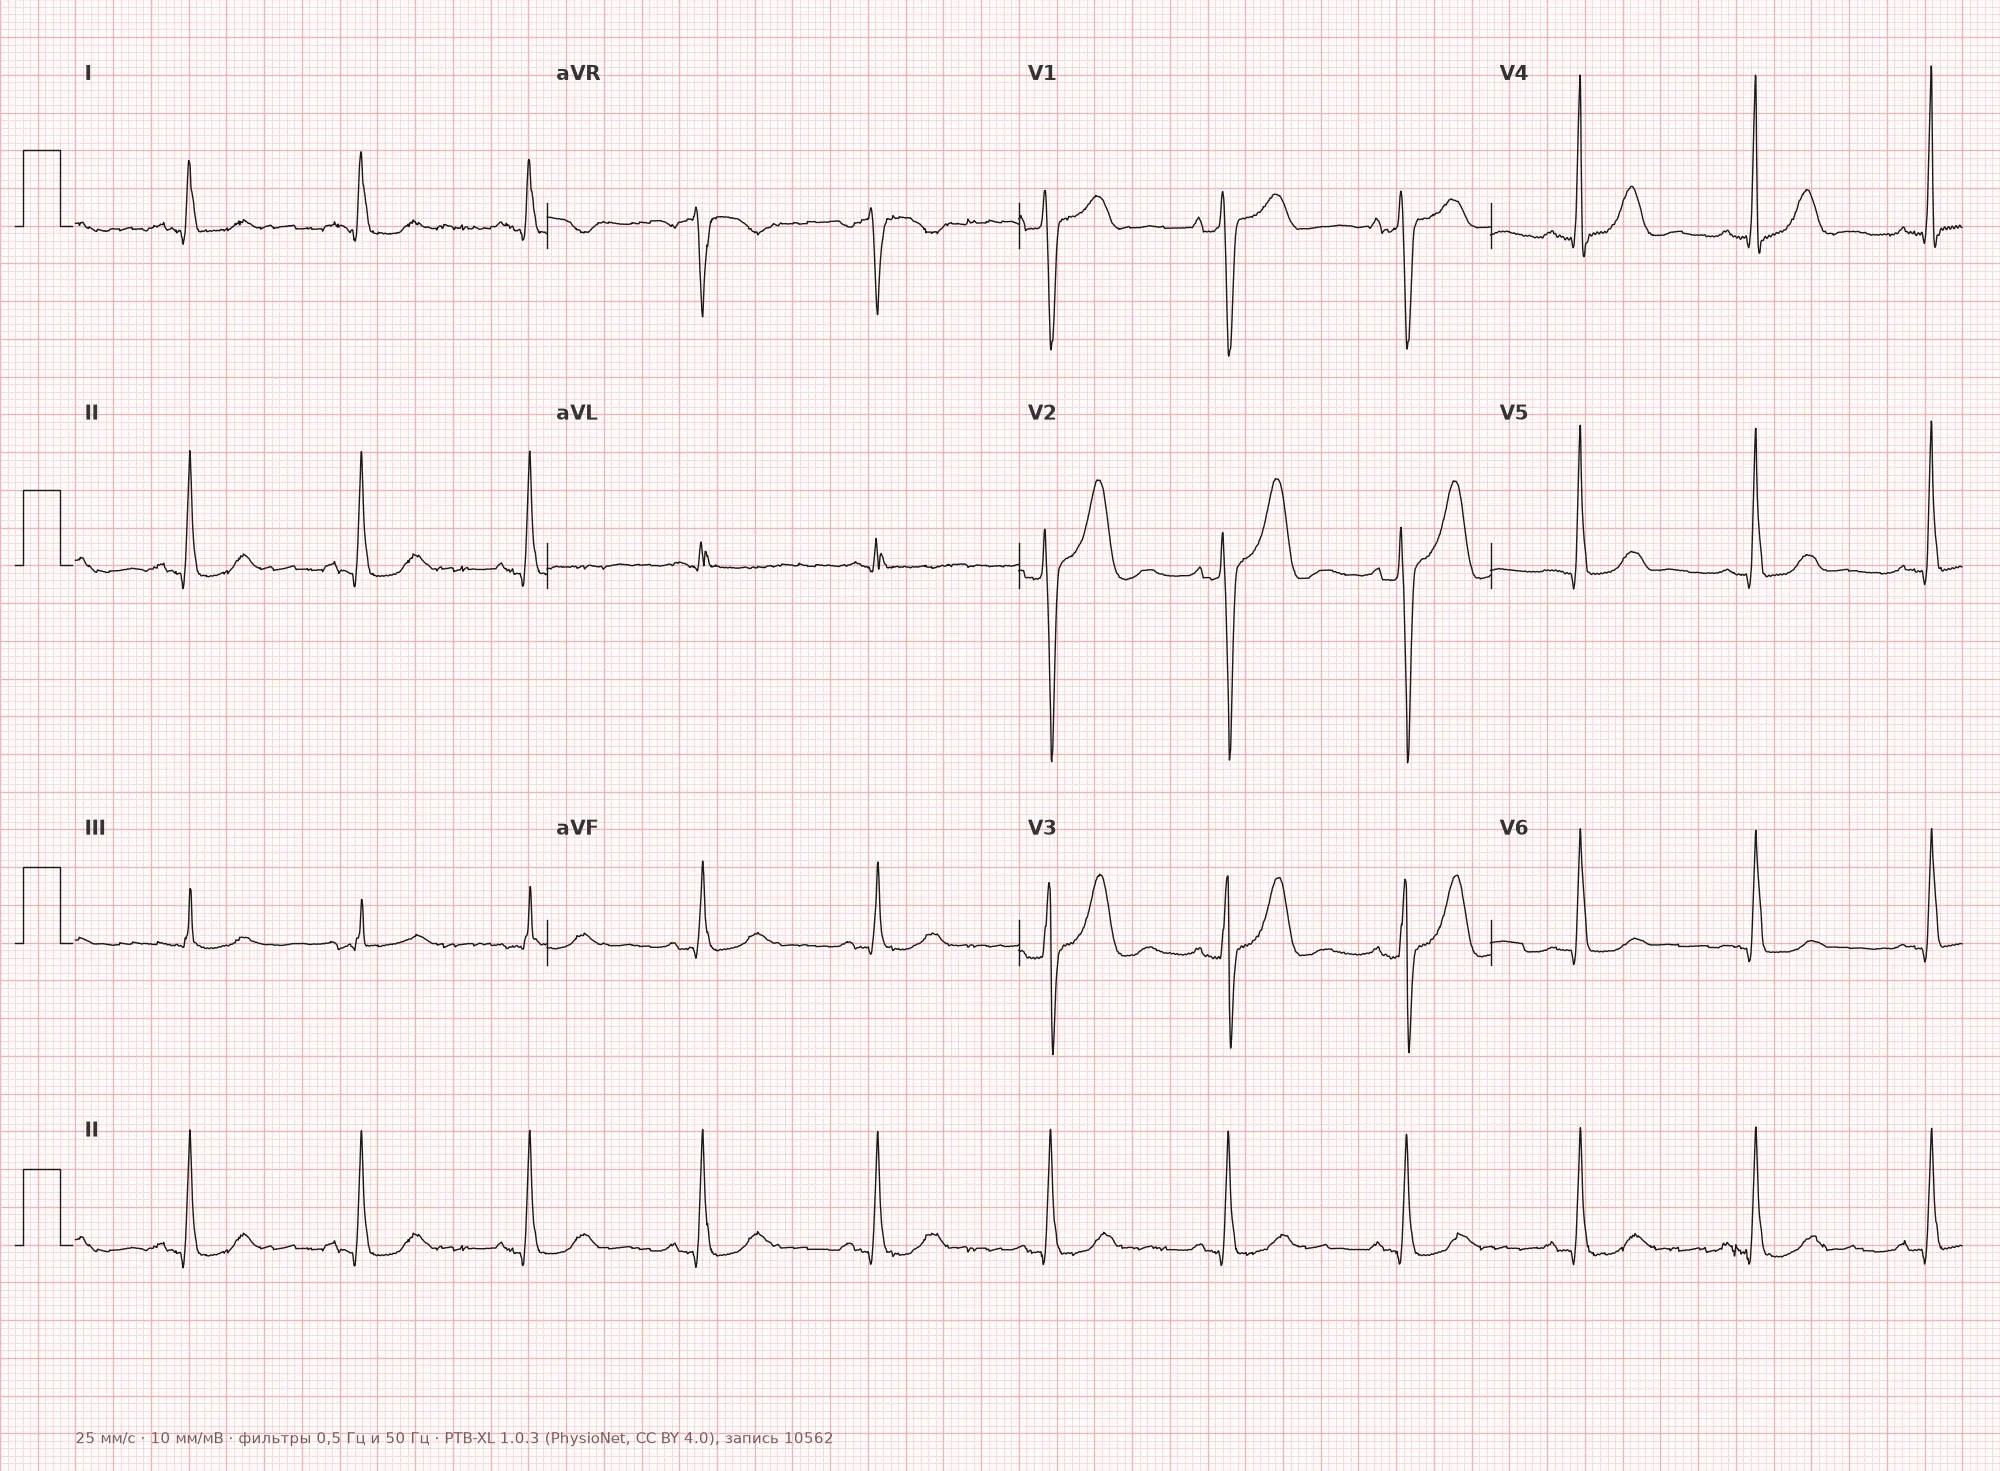
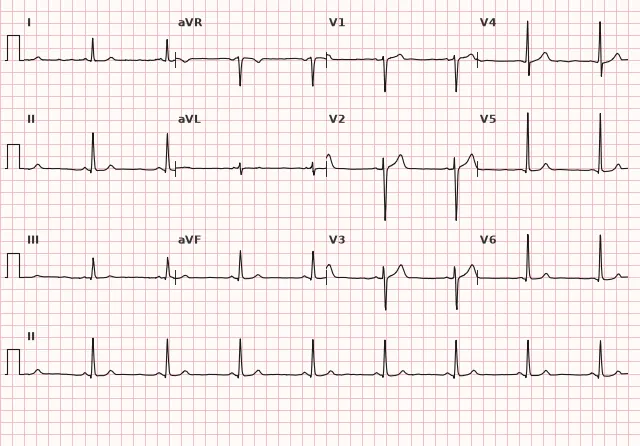
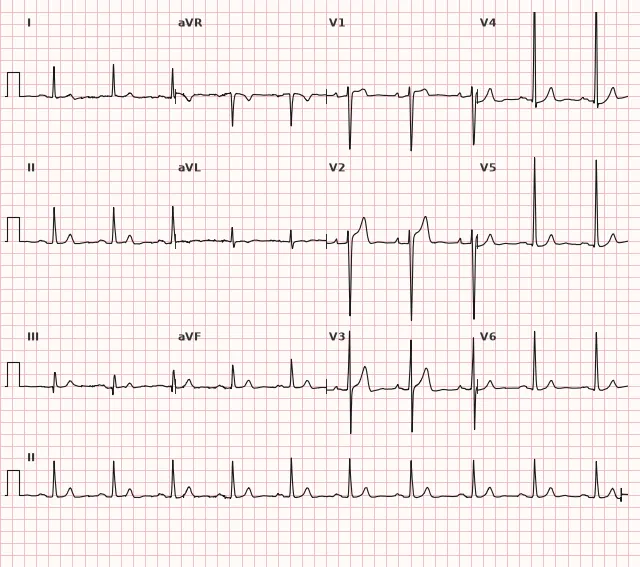
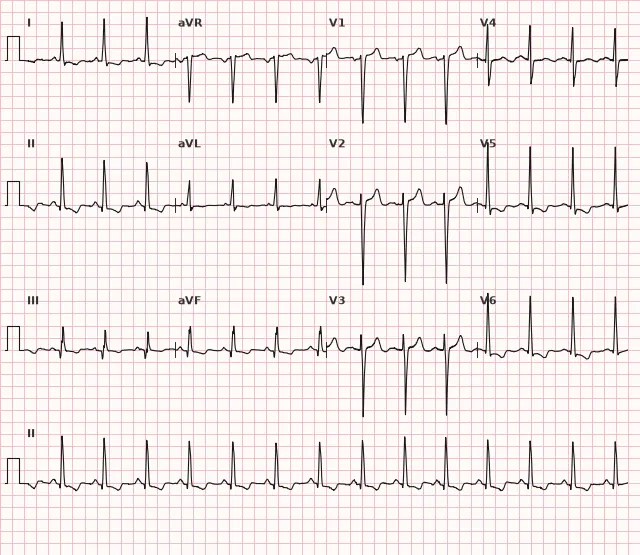
ECG from the open PTB-XL dataset (Wagner P. et al., Scientific Data, 2020; PhysioNet), CC BY 4.0 license. Rendering by WhiteCoat Pro.
Mechanism
Hypertrophy increases the mass and wall thickness of the left ventricle, which increases the total depolarization vector directed towards the left leads. This results in a larger R in V5–V6, I, aVL and a larger reciprocal S in V1–V2. In LVH, the intrinsicoid deflection time in V5–V6 may increase due to altered activation sequence and myocardial remodeling; this sign is nonspecific. ST-T changes in pronounced LVH (strain pattern) reflect secondary repolarization abnormalities associated with pressure overload, increased myocardial mass, and altered ventricular activation sequence; subendocardial ischemia may contribute, but is not a mandatory or solely proven mechanism. The appearance of a strain pattern is associated with a higher cardiovascular risk, and the presence of actual myocardial ischemia should be assessed separately based on the clinical picture and additional data.
Causes
- Arterial hypertension (the most common cause)
- Aortic stenosis and other pressure-overload valvular diseases
- Aortic and mitral regurgitation (volume overload)
- Hypertrophic cardiomyopathy
- Coarctation of the aorta
- Intensive physical training ("athlete's heart", physiological hypertrophy)
- Obesity
Differential diagnosis
- Left bundle branch block — QRS ≥ 120 ms, absence of Q in I, aVL, V5–V6, different complex morphology, whereas in LVH the QRS width is usually normal
- Normal high voltage in young, slender individuals and athletes — without ST-T changes and without left atrial enlargement
- Posterior myocardial infarction — high R in V1–V2 in a different context (ST depression in V1–V3, rather than an isolated voltage criterion)
- WPW syndrome — shortened PQ and delta wave can mimic high voltage and ST-T changes
- Hypertrophic cardiomyopathy — similar voltage criteria, but deep or pathologically wide Q waves may be present in inferior and/or lateral leads, with pronounced ST-T abnormalities; in the apical form, deep negative T waves are seen in precordial leads
Clinical significance and management
ECG signs of LVH are an independent marker of cardiovascular risk, associated with an increased probability of arrhythmias, heart failure, and sudden death, especially in the presence of a strain pattern. The ECG diagnosis of LVH is presumptive: the sensitivity of the method is low, therefore when suspected (voltage criteria, Romhilt–Estes score ≥ 4), echocardiography is indicated to measure wall thickness and myocardial mass — it remains the primary confirmation method. It is important for the clinician to consider the clinical context (history of hypertension, valvular disease, murmurs) and not diagnose LVH based solely on an ECG without imaging.
Common interpretation errors
- Applying voltage criteria without considering age, gender, and body build (in young and slender individuals, high voltage is often a variant of norm)
- Diagnosing LVH in the presence of overt left bundle branch block, where voltage criteria are not evaluated
- Ignoring ST-T changes (strain pattern), which increase the diagnostic value of the finding
- Confusing a strain pattern with ischemia or digitalis toxicity without considering the T-wave contour
- Using a single criterion instead of a comprehensive assessment (it is better to check several at once: Sokolow–Lyon, Cornell, Romhilt–Estes score)
1. Which index is used to diagnose LVH based on the sum of S in V1 and R in V5 or V6?
The Sokolow–Lyon index is a classic voltage criterion for LVH: S(V1) + R(V5 or V6) ≥ 35 mm.
2. What is characteristic of the strain pattern in LVH?
Systolic overload in LVH produces ST depression with an asymmetrical negative T wave specifically in leads with a high R wave.
3. How many points on the Romhilt–Estes scale correspond to definite LVH?
In the classical Romhilt–Estes scoring system, 5 points or more indicate definite LVH, and 4 points indicate probable LVH.
Frequently asked questions
How to distinguish LVH from left bundle branch block?
In LBBB, the QRS duration is ≥ 120 ms, with a characteristic notched morphology in V5–V6, I, and aVL, and absence of Q waves in these leads. In isolated LVH, the QRS duration is usually normal, and the diagnosis is based on voltage criteria.
Is left ventricular hypertrophy dangerous?
LVH may initially be an adaptive response to overload, but pathological LVH is associated with an increased risk of arrhythmias, heart failure, and sudden death, requiring treatment of the underlying cause, usually hypertension. The risk is higher when ST-T changes (strain pattern) appear.
Can LVH be diagnosed based on ECG alone?
ECG provides a presumptive diagnosis with relatively high specificity, but low and variable sensitivity. Echocardiography is required to confirm and assess the degree of hypertrophy.
What is the strain pattern in LVH?
This is a downsloping ST depression with an asymmetrical negative T wave in leads with tall R waves (I, aVL, V5–V6), reflecting systolic overload and more pronounced myocardial involvement.
Why do LVH voltage criteria perform worse in young people?
In young, slender individuals and athletes, high QRS voltage can be a normal variant, which reduces the specificity of certain criteria, including the Sokolow–Lyon index. Interpretation must be correlated with gender, age, body habitus, and concomitant ST-T changes, rather than relying on voltage in isolation.
ECG Course
Interpretation from basics to myocardial infarction — learn to read any ECG using a systematic algorithm.
- Video lessons and theory for every topic
- Simulator case studies under every lesson
- Unlimited ECG simulator practice
- Study guide: "All ECGs in 25 minutes"
ECG Strip Simulator
ECG, radiology, histology, pathomorphology, pharmacology — thousands of flashcards with detailed explanations.
- Real ECG strips, not textbook drawings
- Instant answers and explanations
- Streaks and progress tracking in your dashboard
Related terms
More in the section «Hypertrophy and Chamber Enlargement»
Sources
- Goldberger's Clinical Electrocardiography, 9th Edition
- Surawicz, Knilans. Chou's Electrocardiography in Clinical Practice, 6th Edition
- AHA/ACCF/HRS Recommendations for the Standardization and Interpretation of the Electrocardiogram, 2009
- Orlov V.N. Guide to Electrocardiography
Educational material for medical students and physicians. Does not replace clinical guidelines and physical examination; the ECG must always be interpreted in conjunction with the clinical picture.