ECG criteria
- Q wave in V5–V6, I, aVL: narrow (<40 ms), normally small — the "septal q"; there is no independent depth threshold for diagnosing HCM, and a small q here is frequently a normal variant
- Deep narrow Q waves predominantly in the inferior (II, III, aVF) and lateral (I, aVL, V5–V6) leads, occasionally in the anterior leads — a pseudoinfarct pattern without typical infarction evolution; nonspecific and does not equal a diagnosis of HCM
- Poor R-wave progression and complex alterations in V1–V2 are possible but nonspecific: they require checking electrode placement and ruling out infarction, blocks, and other causes; q/QS in V1–V2 is not considered a typical criterion for septal hypertrophy
- Increased QRS amplitude in the precordial leads (LVH voltage criteria may accompany this)
- Giant negative (inverted) T waves, predominantly in V2–V6, sometimes with deep Q waves or reduced R-wave amplitude — in the apical form of HCM
- Signs of intraatrial conduction disturbance and possible left atrial enlargement (wide notched P in II) — confirmed by echocardiography
- The electrical axis is usually normal, but left axis deviation is possible with pronounced hypertrophy
What it looks like on ECG
The interventricular septum depolarizes first — its activation forms an initial, usually small vector directed from left to right and anteriorly. On the ECG, this appears as a small q wave in the left leads (I, aVL, V5–V6) and a small r wave in the right leads (V1–V2) — the so-called septal q, which is a frequent normal variant.
In septal hypertrophy, especially asymmetric septal hypertrophy in hypertrophic cardiomyopathy (HCM), the initial vector can change in amplitude and direction, but the ECG has no sign specific precisely to septal thickening — all the changes described below are nonspecific and require visualization confirmation.
| Leads | Possible finding |
|---|---|
| II, III, aVF and/or I, aVL, V5–V6 | narrow (<40 ms), sometimes deep Q waves — pseudoinfarct pattern |
| V1–V2 | poor R-wave progression or QS are possible; the finding is nonspecific; improper electrode placement, infarction, and other causes must be ruled out |
| V2–V6 | giant negative T waves are possible (apical form of HCM) |
QRS duration in isolated septal hypertrophy is generally not increased (less than 120 ms), unlike in bundle branch blocks. The intrinsicoid deflection time in the precordial leads may be slightly prolonged due to the thickened myocardium.
ST-T changes are nonspecific and depend on concomitant ventricular overload: when combined with marked LVH, downsloping ST depression and a negative asymmetric T wave appear in the lateral leads.
Real ECGs: 8 examples
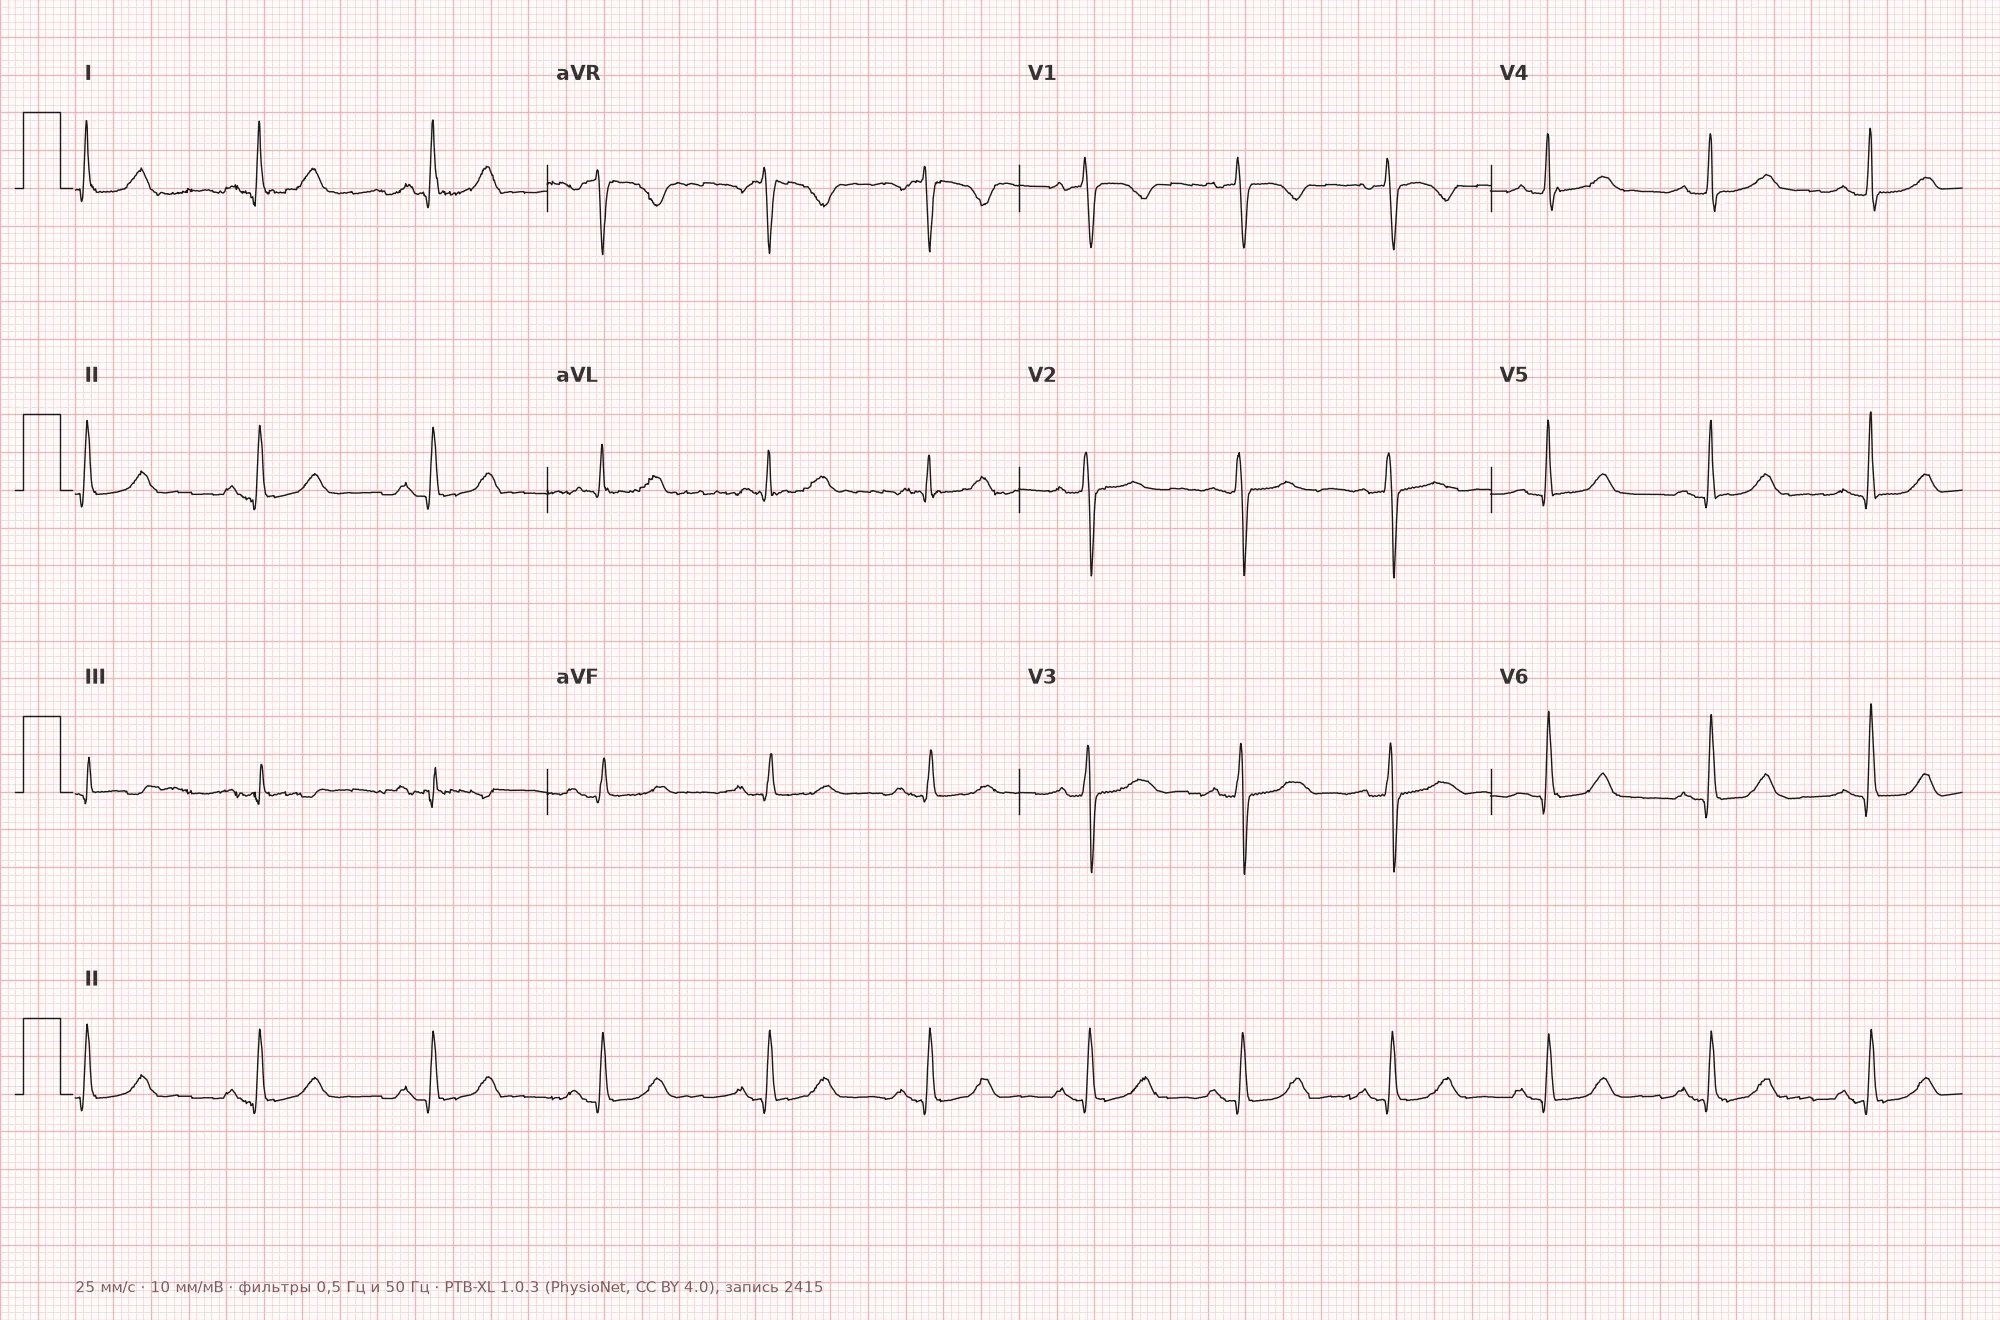
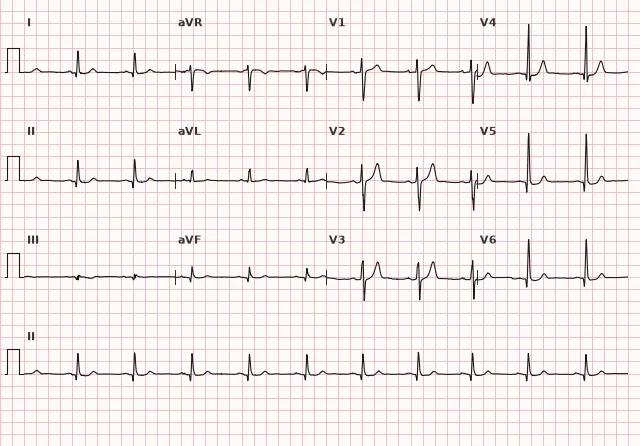
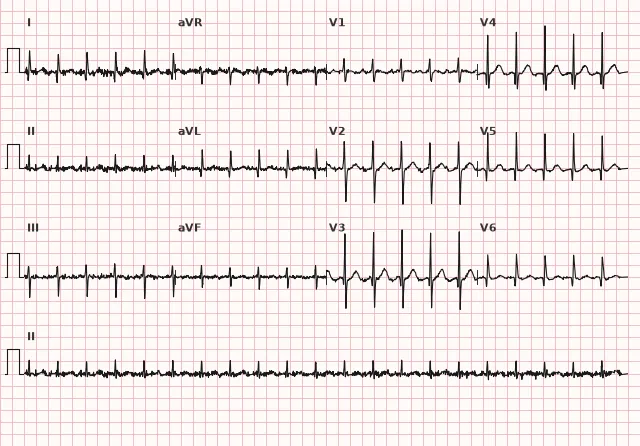
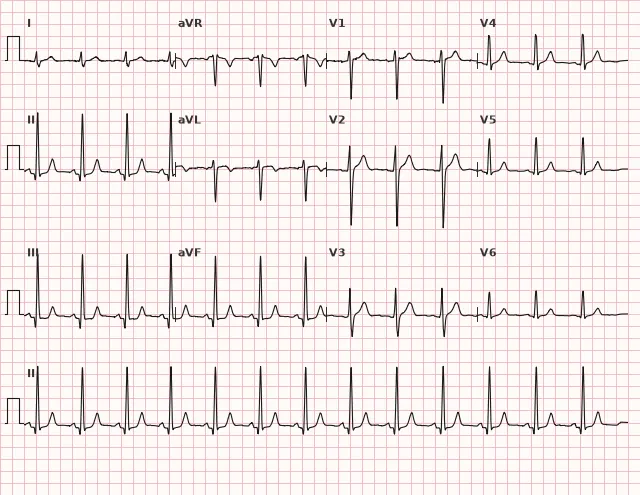
ECG from the open PTB-XL dataset (Wagner P. et al., Scientific Data, 2020; PhysioNet), CC BY 4.0 license. Rendering by WhiteCoat Pro.
Mechanism
Normally, initial septal activation proceeds predominantly from left to right via the His–Purkinje system and forms a small q wave in the lateral leads (I, aVL, V5–V6) and a small r wave in V1–V2. The exact sequence of activation depends on the distribution of Purkinje fibers within the septum.
In hypertrophy and disarray of septal muscle fibers — especially in asymmetric septal hypertrophy in HCM — the sequence and direction of septal activation change, as does its interaction with the activation of the LV free wall. This can alter the initial vector and lead to deep narrow Q/QS waves in the inferior, lateral, or occasionally anterior leads. The pattern is variable and nonspecific: a diagnosis of HCM cannot be made based on a single Q wave.
Causes
- Hypertrophic cardiomyopathy (especially the asymmetric septal form) is the most clinically significant cause
- Arterial hypertension with secondary LV hypertrophy involving the septum
- Aortic stenosis
- Athlete's heart (physiological hypertrophy, usually moderate; some asymmetry is also possible)
- Cardiac amyloidosis and other infiltrative cardiomyopathies (the septum is thickened, but QRS voltage is often low — "voltage/mass" dissociation)
- HCM phenocopies: Fabry disease, Danon disease, mitochondrial cardiomyopathies, and other storage diseases
- Obesity and metabolic syndrome, often indirectly through arterial hypertension
Differential diagnosis
- Prior myocardial infarction (pathological Q wave): pseudoinfarct Q waves in HCM are more often narrow and can be deep, but reliably distinguishing them from infarction Q waves based solely on width and shape is frequently impossible. Clinical context, comparison with prior ECGs, echocardiography, and/or late gadolinium enhancement MRI are required; if acute ACS is suspected, serial ECGs and troponin are needed
- Left bundle branch block: here the QRS is wide (≥120 ms), and the septal q in V5–V6 is absent rather than enhanced
- WPW syndrome: the delta wave shortens PQ and widens QRS, unlike the narrow QRS in isolated septal hypertrophy
- Left ventricular hypertrophy without predominant septal involvement: voltage criteria (Sokolow–Lyon, Cornell) are present, but the characteristic narrow q waves in the inferior/lateral leads may be absent
- Apical HCM (Yamaguchi pattern): giant negative T waves in the precordial leads come to the forefront rather than the Q wave
- Incorrect precordial electrode placement or poor R-wave progression: changes in V1–V2 can mimic findings unrelated to septal thickness
Clinical significance and management
Isolated septal q waves are themselves a frequent normal variant and do not constitute a diagnosis. Clinical suspicion of hypertrophic cardiomyopathy increases if narrow deep q waves in the inferior and/or lateral leads are combined with voltage signs of LVH, negative T waves in the precordial leads, or signs of left atrial enlargement; however, this combination also occurs in secondary LVH (hypertension, aortic stenosis) and does not differentiate these conditions based on a single ECG.
At this stage, the physician should: correlate the ECG with clinical presentation (syncope, dyspnea, exertional angina, family history of sudden death), refer the patient for echocardiography to measure wall thickness and assess LV outflow tract obstruction. The diagnostic threshold for adults is a maximum LV wall thickness ≥15 mm (in the presence of a family history of HCM or carriage of a pathogenic variant, ~13–14 mm is already significant); arterial hypertension, aortic stenosis, and infiltrative/metabolic storage diseases must be ruled out as the cause of thickening.
When HCM is suspected, the risk of sudden cardiac death is assessed using modern factors: age, family history of SCD, unexplained syncope, maximum wall thickness, nonsustained VT on Holter monitoring, left atrial size and outflow tract gradient, LVEF, apical aneurysm, and LGE volume on cardiac MRI; abnormal blood pressure response to exercise has limited, contextual value. Cardiac MRI is indicated when the echocardiographic picture is inconclusive or for fibrosis assessment.
If data point to secondary hypertrophy (hypertension, aortic stenosis), management is directed at treating the underlying disease and controlling risk factors.
Common interpretation errors
- Interpreting any narrow q wave in V5–V6 or I, aVL as pathology — this is a frequent normal variant in healthy individuals
- Considering a q or QS wave in V1–V2 a typical sign of septal hypertrophy — this is a nonspecific finding with a broad differential diagnosis
- Mistaking a pseudoinfarct Q wave for a reliable marker distinguishing it from an infarction Q wave based solely on width — width and depth only assist evaluation, they do not provide a definitive answer
- Ignoring the combination of a q wave with giant negative T waves in the precordial leads — apical HCM will be missed
- Failing to correlate the ECG finding with echocardiography when HCM is suspected, limiting evaluation to the ECG alone
1. Which ECG sign may raise suspicion of asymmetric septal hypertrophy in hypertrophic cardiomyopathy?
The altered initial septal vector can form a narrow, sometimes deep pseudoinfarct Q wave in the inferior and lateral leads, although this sign is nonspecific.
2. Which diagnostic method confirms interventricular septal hypertrophy when suspected on ECG?
Wall thickness is measured using imaging methods; the ECG merely provides a reason for further examination.
3. Which ECG sign is typical for the apical form of hypertrophic cardiomyopathy?
Apical HCM produces characteristic giant inverted T waves in the anterior and lateral chest leads.
Frequently asked questions
Is interventricular septal hypertrophy dangerous?
The ECG finding itself is not dangerous, but if it reflects hypertrophic cardiomyopathy, the risk is associated with left ventricular outflow tract obstruction, ventricular arrhythmias, and sudden cardiac death. Echocardiography and clinical evaluation play a decisive role.
How to distinguish pseudo-infarction Q from infarction Q?
A narrow q wave (less than 40 ms) is more common in septal hypertrophy, whereas an infarction Q wave is usually wider, but this is not an absolute rule: a pathological Q wave in infarction is sometimes narrow, particularly in certain leads. Clinical data, comparison with previous ECGs, serial ECG recording, troponin, and imaging (echocardiography, cardiac MRI) help reliably differentiate them.
Can hypertrophic cardiomyopathy be diagnosed by ECG alone?
No. An ECG may raise suspicion (narrow deep Q waves, negative T waves, signs of left ventricular hypertrophy), but diagnosis relies not on isolated septal hypertrophy, but on unexplained myocardial thickening taking into account age, sex, hemodynamic load, and phenocopies. This requires echocardiography or cardiac MRI with wall thickness measurement and exclusion of secondary causes of thickening.
Is septal hypertrophy always visible on an ECG?
No, the sensitivity of ECG in detecting septal hypertrophy is limited, especially with moderate thickening. A normal ECG does not rule out hypertrophic cardiomyopathy.
How does physiological septal hypertrophy in an athlete differ from HCM?
In athletes, thickening is usually moderate, but some asymmetry is also possible, and wall thickness sometimes falls into the border zone where adaptation cannot be distinguished from HCM based on an ECG or even echocardiography alone. The absence of symptoms or giant negative T waves does not rule out HCM: a comprehensive assessment is required — medical history, left ventricular cavity size, diastolic function, myocardial strain, cardiac MRI, and, if necessary, genetic testing and changes in wall thickness following a period of detraining.
ECG Course
Interpretation from basics to myocardial infarction — learn to read any ECG using a systematic algorithm.
- Video lessons and theory for every topic
- Simulator case studies under every lesson
- Unlimited ECG simulator practice
- Study guide: "All ECGs in 25 minutes"
ECG Strip Simulator
ECG, radiology, histology, pathomorphology, pharmacology — thousands of flashcards with detailed explanations.
- Real ECG strips, not textbook drawings
- Instant answers and explanations
- Streaks and progress tracking in your dashboard
Related terms
More in the section «Hypertrophy and Chamber Enlargement»
Sources
- Surawicz B., Knilans T. Chou's Electrocardiography in Clinical Practice, 2008
- Orlov V.N. Guide to Electrocardiography
- Hampton J.R. The ECG in Practice
- Goldberger A.L. Clinical Electrocardiography: A Simplified Approach
Educational material for medical students and physicians. Does not replace clinical guidelines and physical examination; the ECG must always be interpreted in conjunction with the clinical picture.