ECG criteria
- P-wave duration in lead II ≥ 120 ms (3 mm at 25 mm/s)
- Notched (M-shaped) P wave in II with an interval between peaks ≥ 40 ms
- In V1, the terminal (second, negative) phase of the P wave with a depth of ≥ 1 mm and a duration of ≥ 40 ms (Morris criterion, Morris index: depth × width ≥ 0.04 mm·s) is an auxiliary historical criterion with limited sensitivity and specificity
- In I and aVL, the P wave in left atrial enlargement generally retains a positive polarity, but may be broad or notched; a negative P in I is atypical and requires checking electrode placement, ectopic atrial rhythm, or dextrocardia
- The P-wave axis may deviate from the normal range (0°…+75°), but this is a non-specific finding without an established diagnostic threshold for left atrial enlargement
What it looks like on ECG
The normal P wave is formed by the sequential depolarization of the right and then the left atrium, which is why its duration normally does not exceed 110–120 ms, and in V1 it is usually weakly biphasic with a small initial positive and small negative phase.
In left atrial enlargement, the second half of the P wave (reflecting left atrial depolarization) is prolonged and becomes more pronounced:
| Lead | Sign |
|---|---|
| II | P wave wider than 120 ms, often notched ("M-shaped"), the distance between peaks ≥ 40 ms — classic P mitrale |
| III, aVF | May be notched, similar in shape to II |
| V1 | Biphasic P: initial positive phase (right atrium) + deep wide negative phase (left atrium) ≥ 1 mm deep and ≥ 40 ms wide |
| I, aVL | Positive P polarity is usually preserved, notching or flattening is possible; a negative P in I is atypical for left atrial enlargement |
A convenient quantitative reference for V1 is the Morris index: the product of the negative phase depth (in mm) and its duration (in s) ≥ 0.04 mm·s. This is a historical and auxiliary criterion with limited diagnostic accuracy, which must be correlated with other signs and, if necessary, with echocardiography.
The shape of P mitrale in II (broad, notched) was historically named by analogy with mitral valve disease, in which it is frequently encountered, although the cause of atrial enlargement can be any.
Real ECGs: 8 examples
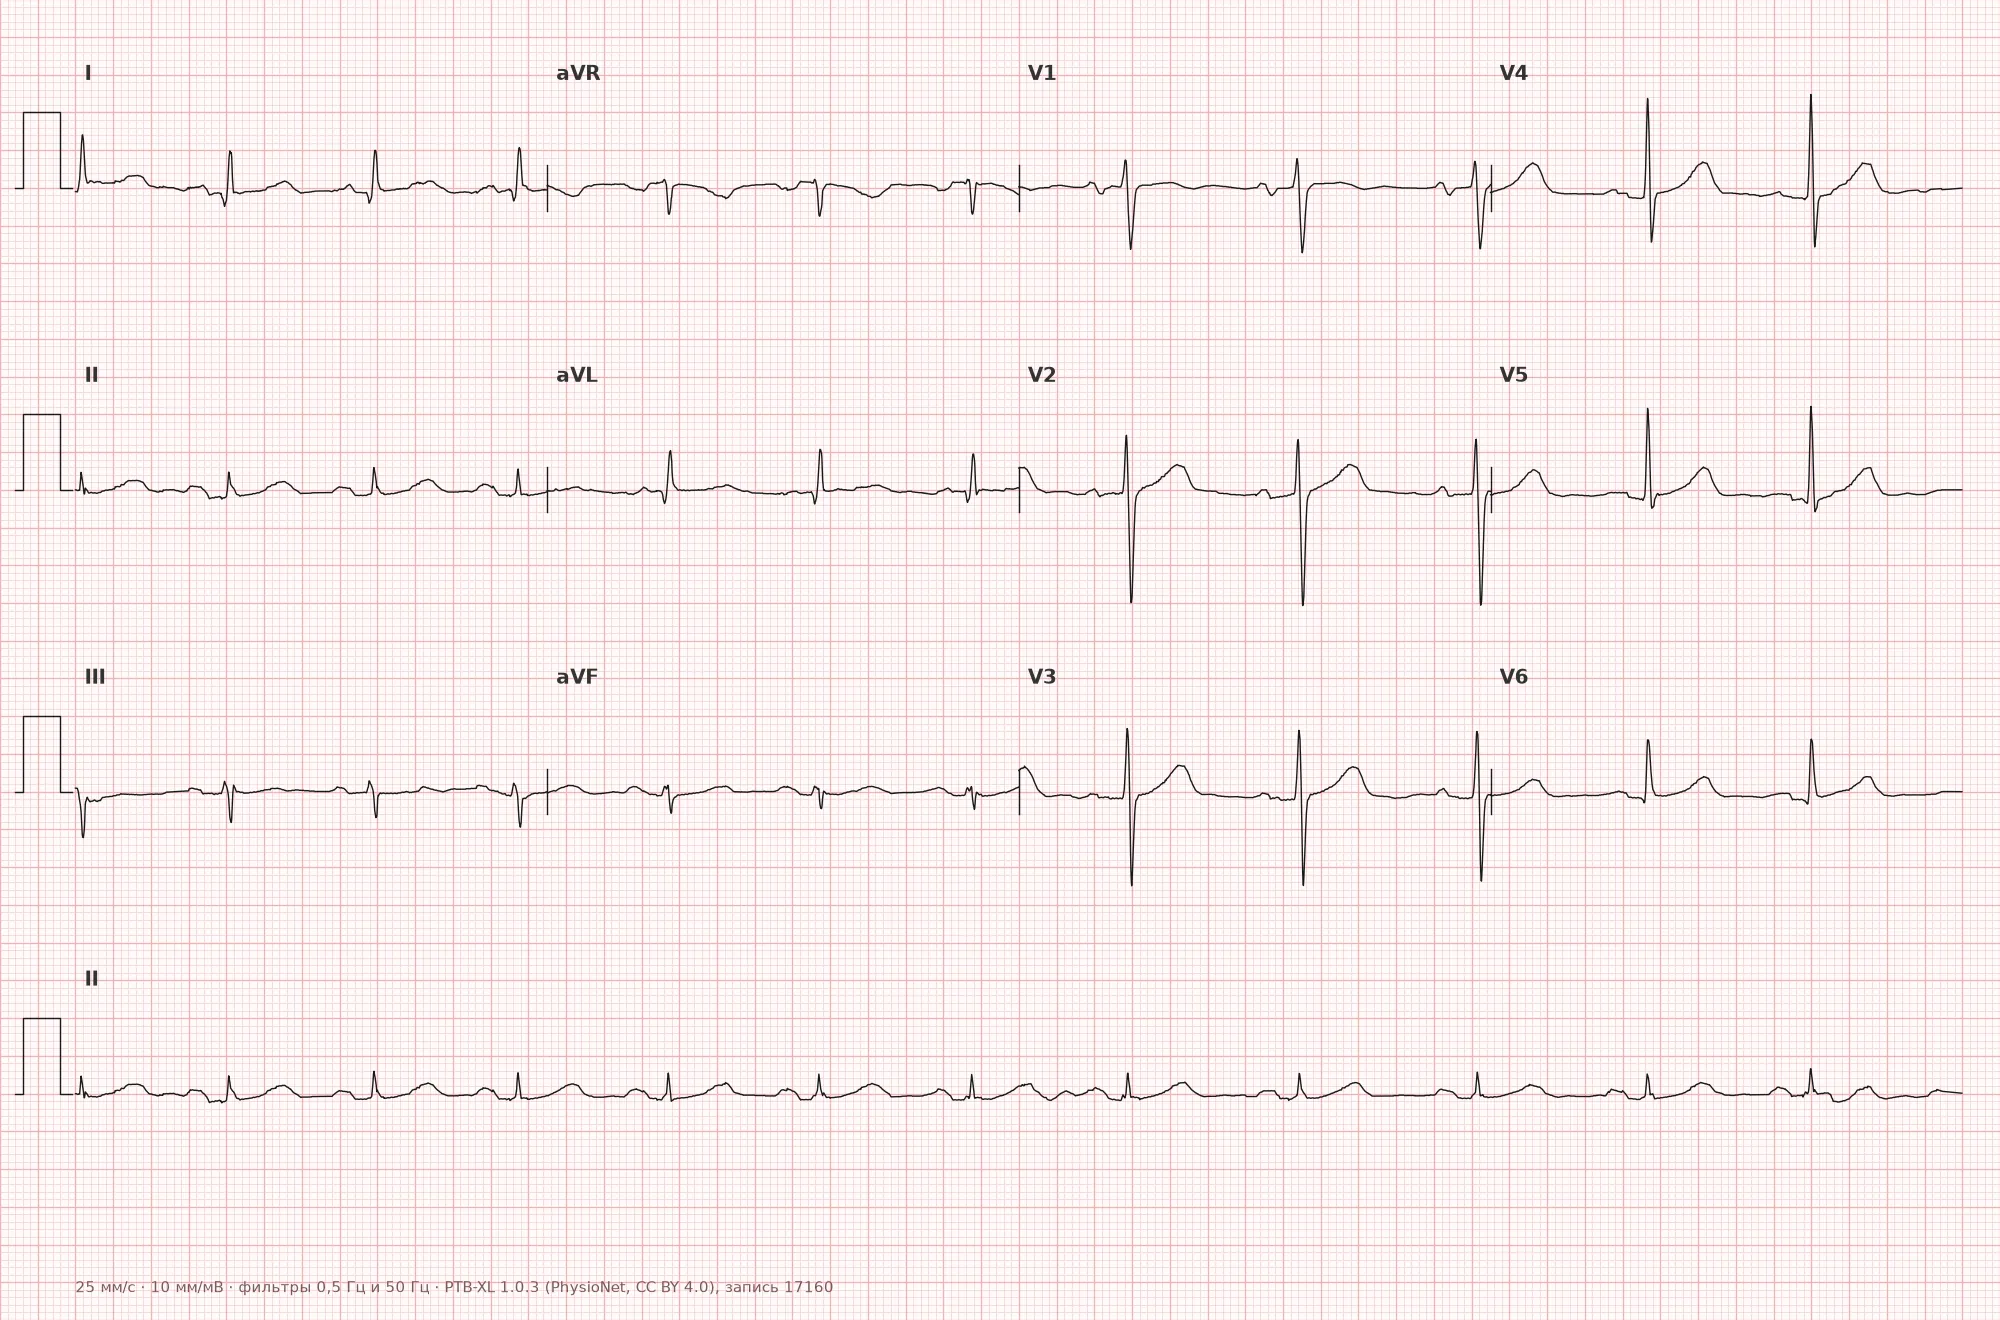
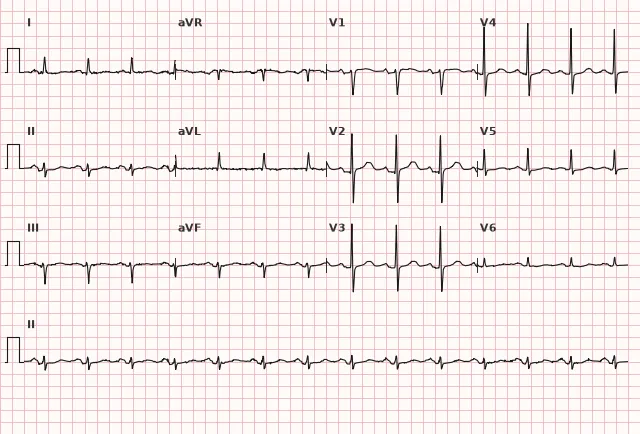
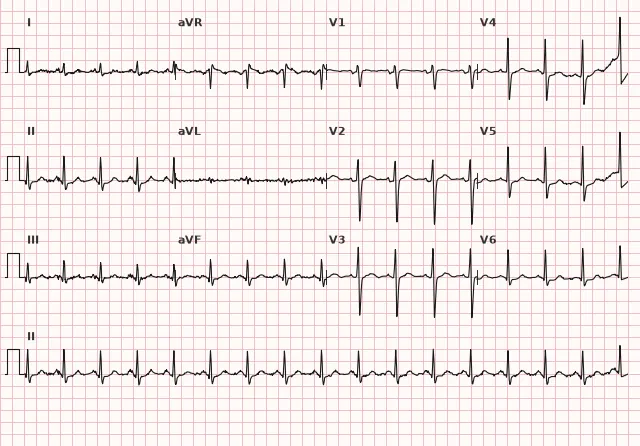
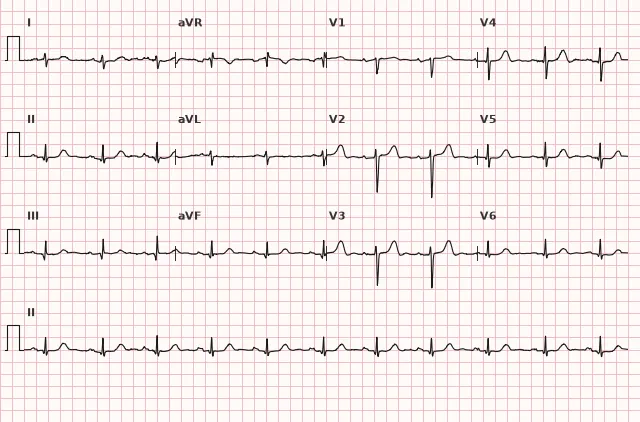
ECG from the open PTB-XL dataset (Wagner P. et al., Scientific Data, 2020; PhysioNet), CC BY 4.0 license. Rendering by WhiteCoat Pro.
Mechanism
ECG signs of P mitrale reflect the delay and abnormality of the depolarization wave propagation through the left atrial myocardium — they are not a direct measurement of anatomical chamber volume and do not reliably differentiate cavity dilation from wall hypertrophy. The term "left atrial enlargement" on ECG is an electrocardiographic marker that does not replace echocardiographic assessment of atrial size and volume.
The left atrium depolarizes later than the right and forms the terminal part of the P wave. When its activation is delayed, the second half of the P wave is prolonged.
In lead V1, the left atrial depolarization axis is directed predominantly posterior and leftward, i.e., away from the V1 electrode — therefore, a negative (negative) terminal phase is formed. In lead II, the net vector of both atria is stretched in time, causing the P wave to broaden and potentially split into two peaks — the first from the right atrium, the second (delayed) from the left atrium.
Causes
- Mitral valve disease: mitral stenosis (classic cause of P mitrale), mitral regurgitation
- Hypertension with left ventricular diastolic dysfunction
- Hypertrophic and dilated cardiomyopathies
- Aortic valve disease with secondary left ventricular and atrial overload
- Coronary artery disease with impaired LV diastolic function
- Congestive heart failure of any etiology
- Congenital heart disease with left-sided overload (e.g., ventricular septal defect)
- A history of atrial fibrillation or atrial flutter and prior left atrial remodeling may be associated with its enlargement (during active atrial fibrillation P waves are absent, and in typical flutter they are replaced by F waves, so these conditions themselves are not the cause of P mitrale detected on a specific ECG)
Differential diagnosis
- P pulmonale (right atrial enlargement) — tall peaked P ≥ 2.5 mm in II, III, aVF with normal or minimally altered width; in V1, the positive initial phase predominates, the negative phase is not deepened.
- Biatrial enlargement — combination of criteria: tall and broad P in II, marked biphasic P in V1 with a large positive and large negative phase.
- Interatrial block — electrocardiographic diagnosis of delayed interatrial conduction without obligatory chamber enlargement. Partial block: P ≥ 120 ms. Advanced (complete) interatrial block: P ≥ 120 ms with a biphasic (+/−) P wave in the inferior leads II, III, aVF. Echocardiography is used to search for a structural cause, not to confirm the block itself.
- Artifact or incorrect limb electrode placement — asymmetry and strange P-wave morphology without clinical signs of left-sided overload should raise suspicion of a technical cause.
- Normal variant in healthy individuals — mild P-wave notching in II without reaching threshold values of width and depth is not considered pathological.
Clinical significance and management
Left atrial enlargement is an electrocardiographic marker, not an independent diagnosis. It increases the likelihood of mitral valve disease, hypertension with cardiac involvement, cardiomyopathy, and is a known predictor of atrial fibrillation development.
Upon detecting P mitrale, the physician should:
- assess the clinical context (auscultation, history of hypertension, CAD, valvular disease)
- refer for echocardiography to evaluate left atrial size, the valvular apparatus, and LV diastolic function
- in newly detected findings and the absence of previously documented heart disease, rule out mitral valve disease and arterial hypertension as the most common causes
- consider the increased risk of atrial fibrillation in such patients during follow-up (Holter monitoring as indicated)
P mitrale itself does not require emergency action, but indicates the need for structural cardiac evaluation.
Common interpretation errors
- Diagnose left atrial enlargement solely based on P-wave morphology in a single lead without measuring width and depth in mm/ms
- Confuse P mitrale with P pulmonale by relying on subjective "looks notched" assessment without quantitative criteria
- Disregard paper speed — at 50 mm/s, the P-wave width is visually doubled, which can lead to a false-positive conclusion
- Ignore lead V1 and make a conclusion based only on lead II, although the terminal phase in V1 is a more specific criterion
- Attribute P-wave notching solely to atrial enlargement without considering interatrial block as an alternative explanation
P mitrale: Broad and Notched in II, Deep and negative "tail" in V1 — think left atrium
1. Which of the following is a classic ECG criterion for left atrial electrocardiographic abnormality in V1?
Deep wide negative terminal phase in V1 is a classic criterion for P mitrale, although its sensitivity and specificity are limited and require clinical-echocardiographic correlation.
2. What is the minimum P-wave duration in lead II indicating left atrial enlargement?
P-wave width ≥ 120 ms (3 mm at 25 mm/s) in lead II is one of the main criteria for P mitrale.
3. Which condition is most commonly associated with classic P mitrale?
The term P mitrale is historically associated with mitral stenosis, in which left atrial overload and enlargement are particularly common.
Frequently asked questions
How to distinguish P mitrale from P pulmonale?
P mitrale is a broad (≥ 120 ms), often notched P wave in lead II with a prominent negative terminal phase in V1. P pulmonale is a tall (≥ 2.5 mm in II, III, aVF) but not widened P wave, with a predominantly positive phase in V1. Width versus amplitude is the main guide.
Is left atrial enlargement dangerous on its own?
The ECG sign itself is not dangerous, but it indicates structural heart disease (most commonly mitral valve disease, hypertension, or cardiomyopathy) and increases the risk of atrial fibrillation. The underlying cause must be investigated rather than treating the sign itself as an emergency.
What is the best-known P mitrale criterion in V1?
The classic Morris index is the terminal negative force of the P wave in V1 (the product of depth in mm and duration in s) ≥ 0.04 mm·s. This is an auxiliary, historically used criterion with limited diagnostic accuracy, and it should be interpreted in conjunction with other signs and echocardiography.
Can the ECG be normal when left atrial enlargement is present on echocardiography?
Yes, the sensitivity of ECG criteria for left atrial enlargement is limited: moderate enlargement may not produce obvious P-wave changes. Echocardiography assesses chamber size more accurately.
Is left atrial enlargement associated with atrial fibrillation?
Yes, left atrial enlargement is one of the main structural predictors for the onset and recurrence of atrial fibrillation, so such patients require careful rhythm monitoring during follow-up.
ECG Course
Interpretation from basics to myocardial infarction — learn to read any ECG using a systematic algorithm.
- Video lessons and theory for every topic
- Simulator case studies under every lesson
- Unlimited ECG simulator practice
- Study guide: "All ECGs in 25 minutes"
ECG Strip Simulator
ECG, radiology, histology, pathomorphology, pharmacology — thousands of flashcards with detailed explanations.
- Real ECG strips, not textbook drawings
- Instant answers and explanations
- Streaks and progress tracking in your dashboard
Related terms
More in the section «Hypertrophy and Chamber Enlargement»
Sources
- Goldberger's Clinical Electrocardiography, current edition
- Surawicz B., Knilans T. Chou's Electrocardiography in Clinical Practice
- Orlov V.N. Guide to Electrocardiography
- AHA/ACCF/HRS Recommendations for the Standardization of the Electrocardiogram, 2009
Educational material for medical students and physicians. Does not replace clinical guidelines and physical examination; the ECG must always be interpreted in conjunction with the clinical picture.