ECG criteria
- Hyperkalemia: tall, symmetrical, narrow-based, pointed ("tented") T wave, often with a decreased QT duration; there is no numerical threshold for the base width, morphology is evaluated
- Hyperkalemia: possible sequence with increasing potassium — flattening/disappearance of the P wave, prolongation of the PQ interval, QRS widening >0.12 s; the order and severity are variable
- Severe hyperkalemia: further QRS widening, fusion of the QRS and T into a sine wave pattern — a pre-terminal sign
- Hypokalemia: flattening or inversion of the T wave, appearance and growth of the U wave, ST segment depression
- Hypokalemia: prolongation of the QU interval (false prolongation of the QT due to fusion of T and U)
- Hypercalcemia: shortening of the QT interval primarily due to shortening of the ST segment; the T wave is usually relatively preserved, but changes in shape are possible
- Hypocalcemia: prolongation of the QT interval due to prolongation of the ST segment with a normal T wave duration
- Hypomagnesemia alone often does not produce a specific ECG pattern; in combination with hypokalemia, QT/QU prolongation and torsades de pointes are possible
What it looks like on ECG
Potassium alters the ECG faster than other electrolytes, making its changes the primary reference point, but they do not develop in a reliably stepwise manner and correlate poorly with specific ion concentration: severe hyperkalemia sometimes occurs without pronounced changes.
Hyperkalemia (K⁺ above normal, exact threshold depends on the laboratory, usually above 5.5 mmol/L): possible sequence — tall, narrow, peaked T wave, primarily in chest leads → flattening and disappearance of the P wave, PQ prolongation → QRS widening >0.12 s → fusion of QRS and T into a sine wave pattern. The order and severity of these changes are variable, and any of the stages may be absent. QRS is measured from the earliest onset to the latest offset of the complex among all 12 leads, rather than in a single arbitrarily chosen lead, otherwise widening may be underestimated.
Hypokalemia (K⁺ below normal, usually less than 3.5 mmol/L): T wave flattening, ST depression, U wave growth (visible in V2–V3), which in pronounced hypokalemia exceeds the T wave in amplitude. Due to T and U fusion, the measured "QT" actually reflects QU.
Calcium: hypercalcemia shortens QT primarily by shortening the ST segment; the T wave is usually relatively preserved, but changes in its shape are possible. Hypocalcemia prolongs QT by prolonging ST with a normal T wave duration.
Magnesium: hypomagnesemia alone often does not produce a specific ECG pattern; in magnesium deficiency, especially together with hypokalemia, QT/QU prolongation and torsades de pointes are possible. Hypermagnesemia can cause sinus bradycardia, PR prolongation, QRS widening, AV block, and in severe toxicity — cardiac arrest; changes depend on concentration and are often nonspecific.
Changes must be evaluated in all 12 leads, not just in selected ones.
| Disorder | T wave | QT/QU | Other |
|---|---|---|---|
| Hyperkalemia | pointed, narrow | normal/shortened | QRS widening, disappearance of P |
| Hypokalemia | flattened/inverted | prolonged (QU) | U wave, ST depression |
| Hypercalcemia | usually preserved | shortened (due to ST) | — |
| Hypocalcemia | usually preserved | prolonged (due to ST) | — |
| Hypomagnesemia | variable | possibly prolonged (often with hypokalemia) | arrhythmogenicity |
| Hypermagnesemia | — | possibly prolonged PR | bradycardia, QRS widening, AV block |
Real ECGs: 8 examples
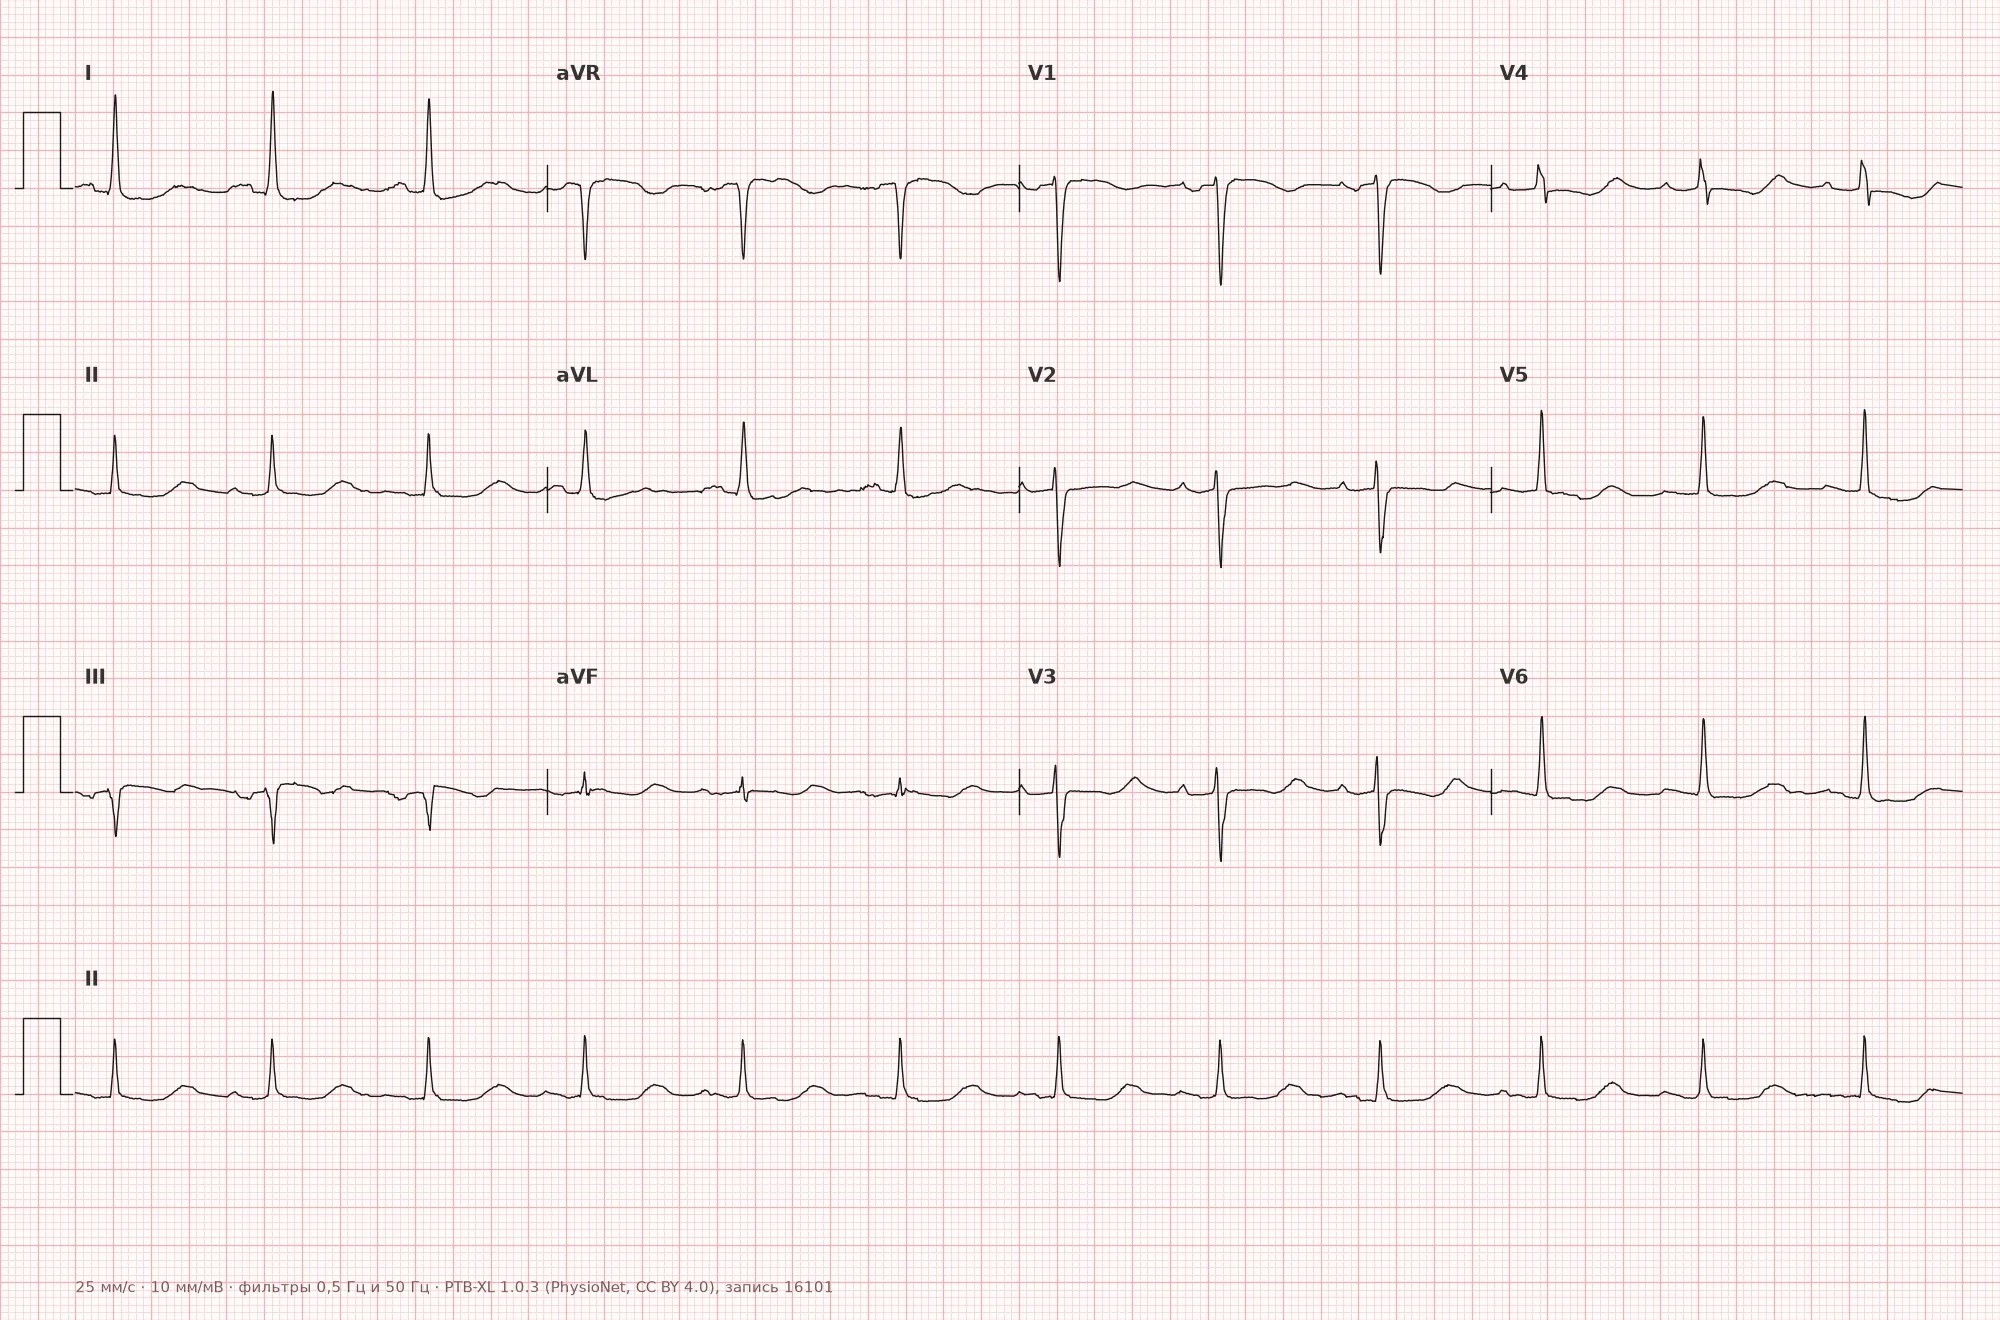
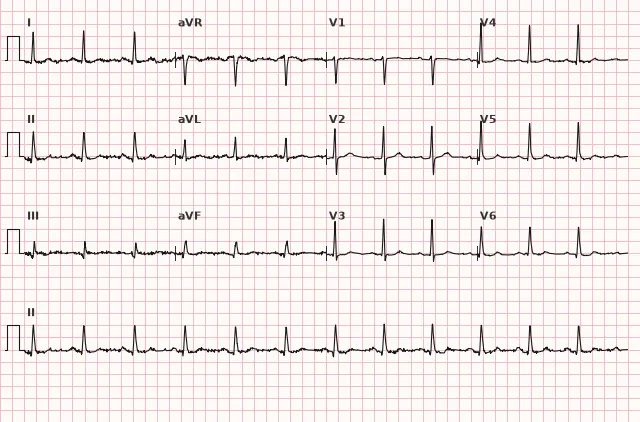
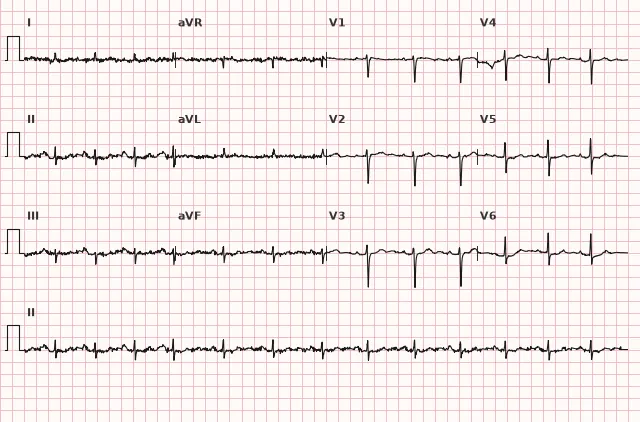
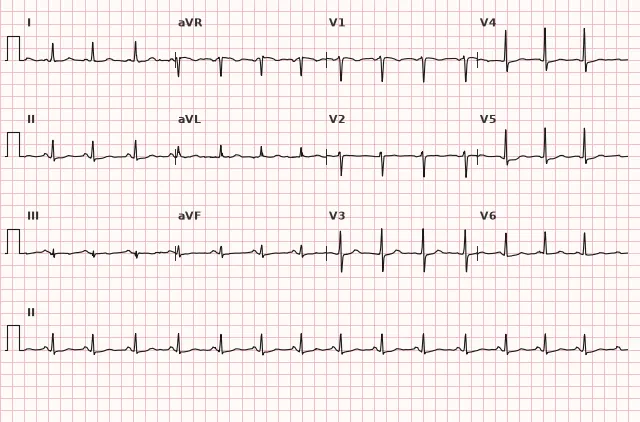
ECG from the open PTB-XL dataset (Wagner P. et al., Scientific Data, 2020; PhysioNet), CC BY 4.0 license. Rendering by WhiteCoat Pro.
Mechanism
Potassium determines the resting membrane potential of the cardiomyocyte and the rate of phase 3 repolarization. The effect of hyperkalemia is biphasic: in the early stages, the resting membrane potential becomes less negative, repolarization is accelerated — hence the peaked narrow T wave and possible QT shortening; with further increases in K⁺, excitability decreases, fast sodium channels are inactivated, and intraventricular and atrial conduction slows down — hence QRS widening, PQ prolongation, and disappearance of the P wave, while the T wave at this stage may become broad and deformed rather than just narrow. Hypokalemia, conversely, slows repolarization and enhances the automaticity of the His-Purkinje system cells, which manifests as T flattening, the appearance of a U wave, and a propensity for ventricular ectopy. Calcium affects the duration of phase 2 of the action potential (plateau): calcium excess shortens the plateau and, accordingly, the ST segment, while deficiency prolongs it. Magnesium acts as a cofactor for many ion channels (including potassium and sodium) and as a natural calcium antagonist, so its deficiency destabilizes repolarization and provokes ventricular arrhythmias, including torsades de pointes.
Causes
- Renal failure (acute and chronic) is the leading cause of hyperkalemia
- Use of potassium-sparing diuretics, ACE inhibitors/ARBs, potassium supplements, NSAIDs
- Rhabdomyolysis, tumor lysis syndrome, massive hemolysis, severe trauma
- Diuretics (loop, thiazide), vomiting, diarrhea, hyperaldosteronism — hypokalemia
- Hypoparathyroidism, vitamin D deficiency, renal failure — hypocalcemia
- Hyperparathyroidism, malignancies with hypercalcemia, vitamin D overdose — hypercalcemia
- Alcoholism, malnutrition, diarrhea, diuretics, proton pump inhibitors — hypomagnesemia
- Renal failure, excessive administration of magnesium preparations — hypermagnesemia
Differential diagnosis
The peaked T wave in hyperkalemia is distinguished from a physiologically tall T in young individuals and athletes by the narrowness of its base and the combination with other changes (QRS widening, P disappearance) rather than isolated amplitude. QRS widening in severe hyperkalemia resembles bundle branch block or ventricular tachycardia, but the complex morphology is more uniform, sinusoidal, without typical block morphology, and the clinical picture (renal failure, laboratory data) points to an electrolyte cause. QT prolongation in hypokalemia and hypomagnesemia must be distinguished from true QT prolongation of other etiology (congenital syndrome, drugs) — the key is correct measurement: in hypokalemia, QU is often measured instead of QT due to a fused U wave. QT shortening in hypercalcemia is distinguished from short QT syndrome and digoxin effect by the ST segment shape and clinical context.
Clinical significance and management
Electrolyte disturbances on an ECG are an indication for immediate blood electrolyte monitoring, primarily potassium: a sinusoidal QRS-T shape indicates a pre-terminal disturbance of excitability and conduction and can rapidly progress to ventricular fibrillation, bradiasystole, asystole, or cardiac arrest. If life-threatening hyperkalemia with ECG changes is suspected, one does not wait for laboratory confirmation: monitoring is initiated immediately and intravenous calcium is administered for membrane stabilization, while blood is drawn concurrently for electrolytes; measures to shift potassium into cells (insulin with glucose, β2-agonist), alkalinization, and potassium removal (diuretics, dialysis) are selected based on the clinical situation, potassium level, glucose, acid-base balance, and renal function. Any change in the T wave or QT interval should be interpreted together with the clinical context (renal function, medication use, vomiting/diarrhea) and the ECG should be repeated dynamically during electrolyte correction — changes are usually reversible and diminish as the ion level normalizes. QT prolongation in hypokalemia/hypomagnesemia increases the risk of torsades de pointes, especially with concomitant use of QT-prolonging drugs.
Common interpretation errors
- Mistaking a tall peaked T wave in a young patient for normal without evaluating the base width and clinical picture
- Measuring QT as QU in pronounced hypokalemia, resulting in a falsely prolonged interval
- Confusing QRS widening in hyperkalemia with bundle branch block or ventricular tachycardia
- Expecting strict staging of changes in hyperkalemia and ruling out the diagnosis due to an "incomplete picture"
- Failing to repeat the ECG after electrolyte correction, even though dynamics are the best confirmation of the electrolyte nature of the changes
1. Which ECG sign is most characteristic of early hyperkalemia?
Acceleration of repolarization with K⁺ elevation at an early stage manifests as a narrow, pointed T wave, primarily in chest leads.
2. What primarily causes the shortening of the QT interval in hypercalcemia?
Calcium excess shortens the action potential plateau phase, which shortens the ST segment, while the T wave usually remains relatively preserved.
3. Which combination of changes is characteristic of severe hypokalemia?
Hypokalemia slows repolarization, resulting in T wave flattening/inversion, ST depression, and a prominent U wave that may merge with the T wave.
Frequently asked questions
How to distinguish hyperkalemia from a normal tall T wave?
In hyperkalemia, the T wave is narrow and peaked with symmetric steep limbs, and is often combined with other changes — P wave flattening, PQ prolongation, and QRS widening. An isolated tall but wide T wave in young individuals and athletes is usually non-electrolyte in origin.
Are electrolyte disturbances on the ECG dangerous?
Yes, especially severe hyperkalemia: QRS widening and a sine wave pattern are pre-terminal signs that can rapidly progress to ventricular fibrillation, bradiasystole, asystole, or cardiac arrest. Marked hypokalemia and hypomagnesemia prolong the QT interval and increase the risk of torsades de pointes.
Can the blood potassium or calcium level be precisely determined from the ECG?
No, the ECG reflects only the functional effect of the electrolyte on the myocardium and correlates with its level indirectly — the severity of changes depends on the rate of onset of the disorder and individual sensitivity; severe hyperkalemia may occur without obvious changes. The diagnosis is confirmed by blood laboratory tests.
Why does the QT interval appear prolonged in hypokalemia?
Due to the growth of the U wave, which merges with the T wave. The measured interval actually represents QU rather than true QT, so it is important to carefully differentiate these waves during measurement.
What happens to the P wave in hyperkalemia?
As potassium levels rise, the P wave gradually flattens, its amplitude decreases, and then it may diminish or disappear on the surface ECG due to depression of atrial excitability and/or impaired generation or conduction of the sinus impulse. The mechanism is usually indistinguishable on a surface ECG.
ECG Course
Interpretation from basics to myocardial infarction — learn to read any ECG using a systematic algorithm.
- Video lessons and theory for every topic
- Simulator case studies under every lesson
- Unlimited ECG simulator practice
- Study guide: "All ECGs in 25 minutes"
ECG Strip Simulator
ECG, radiology, histology, pathomorphology, pharmacology — thousands of flashcards with detailed explanations.
- Real ECG strips, not textbook drawings
- Instant answers and explanations
- Streaks and progress tracking in your dashboard
Related terms
More in "Electrolytes and Metabolism"
Sources
- Goldberger's Clinical Electrocardiography, latest edition
- Surawicz, Knilans — Chou's Electrocardiography in Clinical Practice
- Orlov, V.N. — Guide to Electrocardiography
- AHA/ACCF/HRS Recommendations for the Standardization and Interpretation of the Electrocardiogram, 2009
Educational material for medical students and physicians. Does not replace clinical guidelines and physical examination; the ECG must always be interpreted in conjunction with the clinical picture.